

It’s not limited to Indonesia, but it’s often said that the ultimate goals of the manufacturing industry are twofold: "cost reduction through productivity improvement" and "delivering products on time without delays."
From a management perspective, business plans are crafted to maximize growth based on market supply and demand adjustments. However, even if sales increase due to low pricing, it only reduces gross profit, leading to losses from selling and administrative expenses or non-operating costs. On the other hand, raising unit prices isn’t straightforward due to market price considerations. Therefore, process management based on production plans aimed at reducing costs through productivity improvements—from material procurement to finished products—becomes critical.
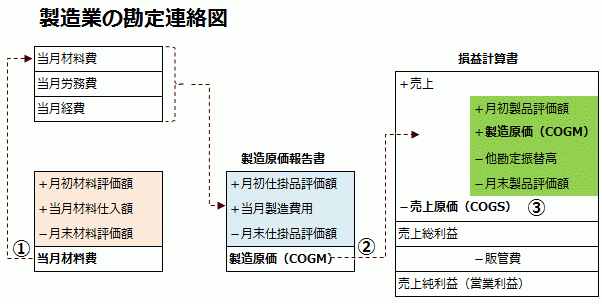
Account Relationship Diagram for Manufacturing
- Beginning-of-month material inventory + monthly material purchases - end-of-month material inventory = monthly material cost
- Beginning-of-month work-in-progress inventory + monthly material cost + monthly processing cost - end-of-month work-in-progress cost = manufacturing cost
- Beginning-of-month product inventory + manufacturing cost - end-of-month product inventory = cost of goods sold
- Sales - cost of goods sold = gross profit
- Gross profit - selling and administrative expenses = operating profit
- Operating profit - non-operating expenses = ordinary profit
Meanwhile, the production site executes production based on the production plan but prioritizes manufacturing customer orders without delays as the ultimate goal.
In environments with significant demand fluctuations, such as those faced by Japanese manufacturing companies in Indonesia, efficient production becomes challenging. Moreover, optimizing efficiency department by department doesn’t always lead to overall optimization, creating a complex challenge of verifying multiple factors to achieve efficient production.
Digital transformation (DX) can be described as the simultaneous achievement of these ultimate goals while realizing productivity improvements.
Japanese manufacturing systems tend to invest heavily in adding functions tailored to their operations, even at high costs. In Indonesia, however, within limited budgets, there’s a stronger demand for features like ease of input for on-site workers, screen modifications to reduce workload, and the addition of external data integration functions.
This blog aims to provide articles on production management systems to help Indonesian manufacturers who feel the need to systematize their production management but are unsure where to start. These articles are intended to assist in envisioning what a manufacturing system suited to Indonesia might look like.
Differences Between Planned Production Manufacturing Orders and Kanban in Indonesian Manufacturing
Both "manufacturing orders" and "kanban" start with material requirements planning (MRP) based on forecasts, but they differ in approach. Manufacturing orders are tangible work units based on production plans (a deductive push system), issued as production instructions from the production management department to the shop floor. In contrast, kanban represents the tangible result of a pull system where downstream processes retrieve what’s needed from upstream processes (an inductive pull system), flowing autonomously on the shop floor based on supply and demand relationships. The Difference Between Planned Production Manufacturing Instructions and Kanban in Indonesian Manufacturing Industry In production management systems implemented in Japanese manufacturing industries in Indonesia, manufacturing orders are generated from forecast information and confirmed orders using the MRP requirement planning function. However, at Toyota-affiliated auto parts manufacturers, they calculate the number of kanban cards and adjust the excess or shortage relative to the number of kanban cards circulating at the production site. 続きを見る
In a kanban-compatible system, MRP enables issuing manufacturing orders from a production perspective, calculating in-process kanban quantities, determining material order quantities or material kanban counts from a procurement perspective, and calculating line or machine loads from an equipment perspective.
Kanban serves as a box-unit production instruction to the upstream process, and the total manufacturing order quantity (total requirement - current inventory + safety stock) is roughly equivalent to "kanban count × box capacity" for the month.
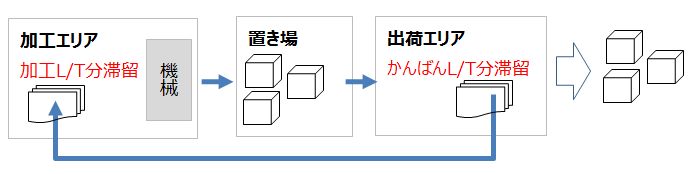
In the kanban system, the ultimate operation—with zero inventory and only in-process stock—occurs when the number of boxes at the parts storage area is zero, and the next retrieval kanban is covered by in-process kanban (work-in-progress kanban) at the processing site.
While it’s fine to produce only the required types in the necessary quantities, if the types and quantities demanded by downstream processes change daily, production costs rise, making it unmanageable. Thus, kanban operations require leveling the types and quantities daily.
In lot production, skilled workers produce the same items in bulk to minimize setup changes. However, leveled production requires evenly distributing various product types, necessitating the externalization of internal setups (main resource setups) into external setups (sub-resource setups), standardization of setups for single-minute setups, and multi-skilled workers. Pursuing leveling ultimately leads to one-piece flow.
Since the kanban system isn’t designed to handle sudden demand fluctuations, combining it with a production scheduler is advisable for appropriate production preparation—such as calculating material requirements from forecast data for raw material and outsourcing arrangements or creating capacity plans based on factory resource forecasts.

Site-Driven Systems Using Schedulers in Indonesia
In Indonesia, where Toyota vehicles are prevalent, many Japanese manufacturers adopt the Toyota Production System’s "kanban" method. However, post-COVID, production has faced fluctuating demand, making process leveling difficult and increasing demands to address shortages and excess inventory. Site-Driven System Using a Production Scheduler in Indonesia We propose a production management approach that combines the pull-type kanban method, which excels at autonomous production adjustments at Indonesian manufacturing sites, with a push-type production scheduler that issues production instructions in response to demand fluctuations. 続きを見る
With large demand fluctuations, monthly leveling becomes challenging, and relying solely on the pull-based "kanban" system is insufficient. This heightens the need for push-based production instructions aligned with demand changes. A hybrid approach—combining flexible production volume instructions per process with a plan and kanban-based adjustments to prevent overproduction—proves effective.

Calculating Time-Based Utilization Rates and Stroke-Based Load Rates
Takt time (T/T) is a target value set by Toyota for subcontractors, indicating how many seconds per unit they should process to meet orders, calculated as "daily available operating time ÷ daily order quantity." Calculation Methods for Time-Based Operating Rate and Stroke-Based Load Factor Load factor is the ratio of demand to a machine's supply capacity. In press processing, it is the ratio of the number of strokes required to fulfill an order to the strokes per hour (GSPH). On the other hand, operating rate is the ratio of actual operating time to available operating time, or the ratio of operating time needed to fulfill an order to the total daily available operating time. 続きを見る
Cycle time (C/T) is derived by the production management department of Toyota’s subcontractors based on next year’s planned operating hours and target production volume, calculated as "daily planned operating time ÷ target production volume."
In the Toyota Production System (TPS), subcontractors are guided to reduce setup times through single-minute setups, aligning cycle time with takt time.
While takt time and cycle time are indicators of production capacity per operating hour, in press processing manufacturing, load rates are calculated as the ratio of strokes needed to fulfill orders against "GSPH × daily operating hours."
For representative left-right set products like car door components, unlike dual-take items, the item codes (parent codes) differ immediately after splitting into left and right, and customers typically order them separately.
Although MRP (Material Requirements Planning) in production management systems can accurately calculate requirements, load rate calculations inevitably deviate because they assume infinite capacity without considering line production capabilities, stacking loads and manually adjusting excess loads for leveling.
In contrast, production schedulers allocate tasks to lines based on order quantities without exceeding 100% resource capacity, enabling precise load calculations even for left-right set production.

Minimizing Inventory and Opportunity Loss Costs with the Beer Game for Overall Optimization
Production management systems achieve partial optimization by dividing management across departments or processes. However, barriers between departments or processes hinder the flow of goods and information, loosening lead times and increasing work-in-progress inventory. Minimizing Inventory Costs and Opportunity Loss Costs in the Beer Game to Achieve Overall Optimization The purpose of the Beer Game is to recognize the importance of reducing inventory costs and opportunity loss costs (backorders) when making decisions about ordering and issuing manufacturing instructions within a supply chain that has a purchasing lead time of 4 weeks and a manufacturing lead time of 4 weeks. 続きを見る
The Beer Game teaches the importance of decision-making in procurement orders (procurement planning) and manufacturing orders (production planning) within the flow of information and goods across the supply chain. Recognizing the significance of reducing inventory costs and opportunity losses informs these decisions. Connecting production processes end-to-end to create flow aims for overall optimization at production sites, highlighting the benefits of introducing production schedulers.

Optimal Inventory in the Supply Chain in Indonesia
General trading companies, with their wide range of products, serve as "one-stop shops" for procurement and sales, managing logistics from downstream to upstream in the supply chain. They also foster businesses through investments and capital participation, combining financial and nurturing functions. Optimal Inventory in the Supply Chain Considered in Indonesia General trading companies have shifted from an agency business to a business model that generates profits in line with added value across the entire supply chain, from upstream to downstream. By formulating a logistics strategy that optimizes the entire supply chain, they contribute to consumer benefits through time reduction and price reductions driven by economies of scale. 続きを見る
This enables them to maintain optimal inventory at decoupling points in the supply chain, avoiding the risks of excess inventory costs and opportunity losses from stockouts.
During the dawn of the internet, it was predicted that individual online shops would rise, allowing small players to compete with large corporations, rendering trading companies obsolete. Yet, 20 years later, their role in managing logistics and financial functions across the supply chain—from raw materials (upstream) to finished products (downstream)—keeps them among the top preferred employers.

Partial vs. Overall Optimization: Lessons from Daily Life in Indonesia
The ideal way to minimize traffic congestion is for all cars to slow down without changing lanes, avoiding complete stops. In reality, however, drivers aiming to reach their destinations quickly and suspecting they’ll lose out by staying still prioritize individual optimization through repeated lane changes, worsening congestion. Partial Optimization and Overall Optimization Considered from Examples in Everyday Life in Indonesia The criteria for optimization vary depending on the context. In the case of traffic congestion, it is throughput (the total movement per unit of time). For corporate activities as players in a market economy, it is profit maximization. In manufacturing production activities, it is productivity improvement and cost reduction. The optimal criteria differ based on perspective and objectives. 続きを見る
In a group with conflicting interests, decisions based on individual emotions lead to partial optimization, exacerbating congestion. If all drivers considered others, limiting their own desires for the sake of mutual benefit, overall optimization—early congestion relief—could be achieved, allowing everyone to get home faster.
Organizations like companies or militaries differ significantly from society at large, as they can suppress individual selfishness for the shared goal of profit maximization.

Operation Management, Trend Analysis, and Predictive Maintenance via IoT in Indonesian Manufacturing
In Indonesian manufacturing, the importance of paperless systems to minimize physical contact between personnel and IoT to reduce indirect contact via paper or PCs is recognized. This drives efforts toward Manufacturing Operations Management (MOM), integrating and automating production processes—from planning and manufacturing management to labor management, quality control, and operation management. Operational Management, Trend Management, and Predictive Maintenance through the Introduction of IoT in Manufacturing in Indonesia In the context of IoT in manufacturing, "connecting things to the internet" refers to collecting data on the actual quantities and times of production goods like products, as well as maintenance information for capital goods such as machinery. However, conducting operational and trend management for predictive maintenance, and using that data to prevent machine downtime or analyze the causes of performance degradation, directly contributes to productivity improvements. 続きを見る
For equipment operation management, signals from PLCs or indicator lights track operating and downtime, calculating Overall Equipment Effectiveness (OEE) based on availability factor, performance factor, and yield.
Maintenance management involves daily upkeep to prevent breakdowns, analyzing equipment changes and failure trends numerically and sharing equipment records or troubleshooting cases across departments. It includes "preventive maintenance" (e.g., periodic parts replacement based on press shot counts or operating hours) and "predictive maintenance" (forecasting issues before they occur).

Smart Factories in Indonesia Realizing Industry 4.0
Manufacturing systems are shifting from Enterprise Resource Planning (ERP)—divided into business functions like production management, planning, sales/procurement, and inventory management—to Manufacturing Execution Systems (MES), focusing on shop-floor management of people and machines. The future lies in Manufacturing Operations Management (MOM), integrating and automating production processes like planning, scheduling, manufacturing, labor, and quality management. Smart Factories in Indonesia Realizing Industry 4.0 The concept of a smart factory embodies the realization of Industry 4.0 through the digital transformation (DX) of manufacturing. Specifically, it involves collecting and managing shop-floor-level data with MES (Manufacturing Execution System) to improve production efficiency and reduce manufacturing costs, while further advancing automation through MOM (Manufacturing Operations Management). 続きを見る
MES sits between the upper ERP layer and the lower PLC layer, issuing work instructions to workers based on production schedules, monitoring raw materials and work-in-progress in real-time, and connecting to production equipment to track operations and anomalies. Digitizing MES drives automation, realizing smart factories through MOM.
Errors before data reaches digital networks—such as transcription mistakes from paper to systems or input errors—are addressable most effectively through paperless systems and IoT.
Industry 4.0 shifts IT-centric software implementation to hardware, connecting hardware and networks for faster, more accurate data collection and analysis, enhancing productivity and quality.

Shop Floor Efficiency and Visualization for Indonesian Manufacturing
We held a co-hosted seminar featuring a PDCA cycle: creating production plans with the Asprova scheduler, recording manufacturing results via tablets with Cybozu Kintone, and visualizing planned vs. actual data with WingArc Motion Board. Doable on the Shop Floor! Operational Efficiency and Visualization for Indonesian Manufacturing Factories Today, I’ll be handling the initial "Plan" part of the PDCA cycle, which involves creating a production plan with a system, recording manufacturing performance on a tablet, and visualizing scheduled versus actual data using a BI tool. 続きを見る
Recent challenges for Japanese manufacturers in Indonesia include shorter product lifecycles leading to multi-variety, low-volume production, demand fluctuations, rising labor costs, and competition with non-Japanese firms. The greatest effort lies in improving production efficiency, optimizing factory resources, and reducing inventory costs and opportunity loss risks.
Production schedulers provide end-to-end visibility from orders to production and procurement, creating cycle-time-based plans considering equipment capacity. This shortens lead times for per-unit productivity gains and reduces inventory costs through stock reduction.
Functions of CEISA, Indonesia Customs’ Automated Tariff and Excise Information System
Customs prioritizes linking the BC number on the delivery note (Surat Jalan) for incoming raw materials with the BC number newly assigned to the shipping note (Surat Jalan) for finished products. This ensures tax-exempt imported materials are properly processed into products in bonded factories and shipped appropriately. Functions of CEISA, the Customs and Excise Information Automation System Provided by Indonesian Customs In 2013, customs mandated the introduction of an IT Inventory system for bonded factories to track the movement of quantities such as materials, work-in-progress, products, and scrap. However, starting in December 2019, it has also become mandatory to install an accounting system to report the connection between these quantity movements and their corresponding monetary values in accounting. 続きを見る
The issuer of the BC number registers the transaction in CEISA and obtains customs approval. In transactions between bonded factories (KB), the shipping KB obtains BC27. For non-bonded factories (Non-KB) without CEISA, the KB issues BC41 when shipping and obtains BC40 upon receipt.

From Specification Finalization to Operation of Production Management Systems in Indonesia
In requirements definition, the operational flow—how the system issues instructions and records results based on shop-floor movements—is finalized. Gaps in standard system functions are addressed with add-on development. During operational briefings or training, feedback from shop-floor staff informs specification tweaks or additional development. Rehearsals, where each department inputs data end-to-end, confirm interdepartmental coordination needs for actual operations. Until the specifications of a production control system are finalized in Indonesia and implemented on-site A production management system covers production activities from the receipt of materials into the material warehouse until they are processed in the manufacturing process, as well as sales activities from the product warehouse onward. The costs incurred as material costs and processing costs arise when materials are introduced into the manufacturing process, become manufacturing costs when turned into products, and become the cost of goods sold when shipped. Managing this series of cost flows is the role of a cost management system. 続きを見る
Introducing production management systems often incurs unpredictable labor costs. Over-focusing on costs can lead to simpler implementations, creating hesitancy with clients and undermining confidence. Once labor and cost agreements are settled and implementation begins, prioritize client convenience above all. A commitment to improving their operational efficiency ensures resilience against project challenges—this is the pride of an IT service provider.
In the implementation phase—issuing instructions and recording results aligned with people and material movements—theories crafted at the desk come to life, akin to a soul returning to its body. This moment encapsulates the reward and joy of business system implementation.
From inventory and cost perspectives, factories divide into material warehouses, production processes, and product warehouses, typically managed by different departments. Production management tracks receipts and disbursements to calculate manufacturing costs, while sales management does so for the cost of goods sold. Material warehouses and production processes are production sites, while product warehouses are sales sites.
Business flows involve quantities and amounts. Inventory management oversees quantity flows, requiring at minimum: current inventory lists, stock transaction histories (stock cards), and receipt/disbursement processing.

Long (Buy) vs. Short (Sell) Positions in Position Management
In Indonesia, commodities like coffee and palm oil experience drastic market price swings. Companies enter long (buy) contracts anticipating future demand or material price hikes, or short (sell) contracts expecting sales price drops. Long positions incur losses if prices fall, while short positions lose if prices rise. The Difference Between Long (Buying) and Short (Selling) in Position Management In the inventory business, purchase contracts are made in anticipation of future demand and rising material costs, while sales contracts are made in anticipation of falling selling prices. However, this creates the risk of market fluctuations moving in the opposite direction. To manage this position effectively, it is necessary to distinguish between inventory that is tied to sales contracts and inventory that is not. 続きを見る

Bill of Lading (B/L) Issued by Shipping Companies Based on Invoices and Packing Lists
When shipping furniture from Indonesia to Japan via container, a Bill of Lading (B/L) from an Indonesian shipping company is required, based on the Invoice, Packing List, and Certificate of Origin (COO), proving cargo acceptance. For exports, the B/L date marks the sales recording date. A Bill of Lading (B/L) issued by the shipping company to certify the acceptance of cargo based on the Invoice and Packing List The Bill of Lading (B/L) is issued by an Indonesian shipping company based on the Invoice, Packing List, and Certificate of Origin (COO) to certify the acceptance of cargo. In the case of exports, the B/L date becomes the sales recording date. 続きを見る
The shipping company sends the B/L to the cargo company, which forwards it to the consignee in Japan. Delays in B/L issuance follow-up from the cargo company can result in the consignee receiving an Arrival Notice from the Japanese shipping agent without the B/L, preventing cargo pickup.
In such cases, request the cargo company to have the issued B/L surrendered (endorsed by the shipping company as the consignee’s cargo, also called telex release) and sent to the Japanese consignee via fax instead of mail.
Implementing Returns Processing in Production Management Systems
In Indonesia’s automotive parts industry, sales are typically recorded at shipment. Shipment completion automatically processes sales, and returns often involve replacement shipments (Tukar Guling). Systematically, this requires post-month-end return sales order entry and return shipping entry, issuing negative invoices, negative shipments (return receipts), and negative sales. How Return Processing is Implemented in a Production Management System In Indonesia, return processing commonly involves a method called Tukar Guling, where replacement goods are sent without revising the original Delivery Note or Invoice. 続きを見る

Introducing QR Code Management with Smartphones in Indonesian Operations
Lot management aims for lot traceability and inventory accuracy, requiring product labels issued by the system to be attached to lots. Recording results in the system with lot numbers as items move ensures consistency between physical items and the system.
Recording results by location (process) tracks "what and how many are where," but since the smallest inventory unit is a "location," casually verifying "if physical counts match theoretical values" is challenging.
Recording by lot—the unit of physical movement—allows checking "how many are in this lot" at each destination. This equates to constantly verifying total inventory theoretical values through role division. Lot quantities are overwritten by downstream process results, converging toward accuracy downstream.
Barcode readers (scanners) simply scan barcodes to input data, reducing manual keyboard entry effort and preventing input errors.
Handheld terminals typically refer to batch-type devices that transfer collected data to PC business systems, gathering results against pre-issued instructions.
Wireless handheld terminals (with OS like Android or Windows CE) differ from batch types, wirelessly transmitting scanned barcode data for real-time processing.
Options include collecting results with handheld terminals against system-issued instructions, verifying scans match instructions before linking to the core system, or scanning items without instructions and recording results in the core system.
■ Recording Results Against Instructions and Reflecting in the Core System
- Receipt: From uninspected area to material warehouse—attaching labels upon inspection pass
- Material disbursement (disbursement instruction): From material warehouse to production site
- Material return: From production site to material warehouse
- Product receipt: From production site to product warehouse—attaching labels upon inspection pass
- Shipment (picking list): From product warehouse to shipping area
- Disposal: From warehouse to disposal area
- Inventory count (inventory list): Warehouse
■ Recording Results Without Instructions in the Core System
- Shelf transfer: From shelf to shelf
-
-
Introducing a QR Code Management System Using Smartphones for Business Operations in Indonesia
While data collection through barcode or QR code scanning has long been part of business system development and implementation, our company has, in recent years, been recommending QR code management via smartphones to clients considering on-site terminal導入 at manufacturing sites or warehouses.
続きを見る
Picking Lists for Matching Item and Lot Information on Product Labels at Shipment
During shipping, items scheduled for the day are retrieved from the warehouse and stacked in the shipping area. A picking list, consolidating items by shipping unit, is matched against physical items. A picking list for verifying item lot information on physical labels at the time of shipment In Indonesian manufacturing, a picking list is created by grouping the item lot detail lines from a list of registered shipping instructions into shipping units at the time of shipment. It is used to verify whether the physical goods match the item lots registered at the time of order entry. Comprising shipping instruction numbers (header) and item lot numbers (details), shipping performance is recorded accordingly. 続きを見る
Within the sales management shipping function, shipping instructions tied to order data are entered. The picking list bundles these instruction details into sorting units. For example, for export to Japan today, a picking list number is assigned to products loaded into a 40-foot container, the products in the shipping area are scanned for verification, and shipping completion is registered if the match is confirmed.
Order entry, shipping instructions, and picking-based shipping results are recorded by item (lot) detail lines. However, when loading onto trucks or containers, multiple items are grouped into packaging units for damage prevention, and a packing list is submitted to the shipping company.

Proposals for Japanese Companies in Indonesia Struggling with Production Management Systems
When Japanese manufacturers in Indonesia express difficulties with production management, the issues often boil down to "invisible, misaligned, disconnected" problems: inability to see how moving goods connect to shipments, forcing operations into ill-fitting systems leading to excessive Excel use, and disconnected interdepartmental workflows causing wasteful external adjustments. Recommendations for Japanese Companies in Indonesia Struggling with Production Management Systems All internal business operations are ultimately connected to revenue, which is the source of a company's cash inflow, and purchasing, which is the source of cash outflow. When three key issues arise—lack of visibility into the current state, discrepancies in figures, and a disconnect in process flow—it not only reduces operational efficiency but also leads to a decline in employees' awareness of sales and cost management. 続きを見る
A company’s business is defined by what it offers to meet market needs, determining how it interacts with customers and suppliers and how internal staff collaborate, shaping internal operations. All internal operations tie back to sales (shipments)—the source of revenue—and procurement—the source of expenditure.
Economic activity is the aggregation of adding value to goods or services along the supply chain; merely siphoning money without adding value isn’t economic activity.
In environments like Indonesia, where internal decisions may be driven by individual or departmental political agendas or where supply chain constraints complicate commercial practices with customers, suppliers, and subcontractors, internal operations take on a unique cultural flavor. As stakeholders seek the easiest methods, this results in a collection of partial optimizations.
Excel becomes a favored patch for linking these partial optimizations. The only solution is to diligently consolidate key requirements from these culturally shaped operations and implement them systematically, with consideration for Indonesian staff’s perspectives, ensuring "visibility into the processes behind system outputs."

Possibilities of In-House IT System Development for Operational Improvements in Indonesia
When Japanese manufacturers in Indonesia consider IT system development, outsourcing struggles to adapt to changing operational flows, while in-house development lacks IT-skilled personnel, and systems built by artisan IT experts risk over-dependence on individuals—highlighting issues with both approaches. "The Potential of In-House IT System Development for Achieving Business Improvements in Indonesia As the features provided by Kintone and AppSheet become more advanced, Indonesia is also entering an era where in-house development of business systems is becoming possible. We believe that essential business transformation through IT is more advantageous when done in-house rather than outsourced. 続きを見る
The ideal IT-driven operational improvement in Indonesia is "a system flexible to environmental changes like Excel, buildable by operational staff without advanced IT skills." Such a convenient tool didn’t exist, forcing reliance on outsourcing. However, tools like Kintone and AppSheet are making practical proposals feasible.

Usable vs. User-Friendly Systems in Indonesia
- Night shift results uploaded the next morning cause negative inventory, preventing DO issuance.
- Goods arrive without an invoice, delaying purchase entry, inventory recording, and shipment.
- Shipping instructions assume inventory allocation, but lack of goods prevents prior-day instructions.
- Ordered but unshipped items are tracked as backlog, but ordered but uninstructed items aren’t.
- Materials used immediately and turned into manufacturing costs lack invoices, excluding them from cost calculations.
- Receipt/shipment corrections unfinished before closing prevent physical inventory reflection.
- Irregular processing (material disbursement/return, defects, separately managed items) struggles with result entry or label issuance.
- Correcting errors found in physical inventory is desired, but if lots have reached customers, canceling DOs or invoices reassigns new numbers.
-

-
A System Usable in Indonesia and A User-Friendly System
Project success means completing the project on schedule and having the system operate according to requirements. As a result, this means a system usable in Indonesia has been created, but a user-friendly system is one with a gentle interface where the desired operations are immediately apparent.
続きを見る