


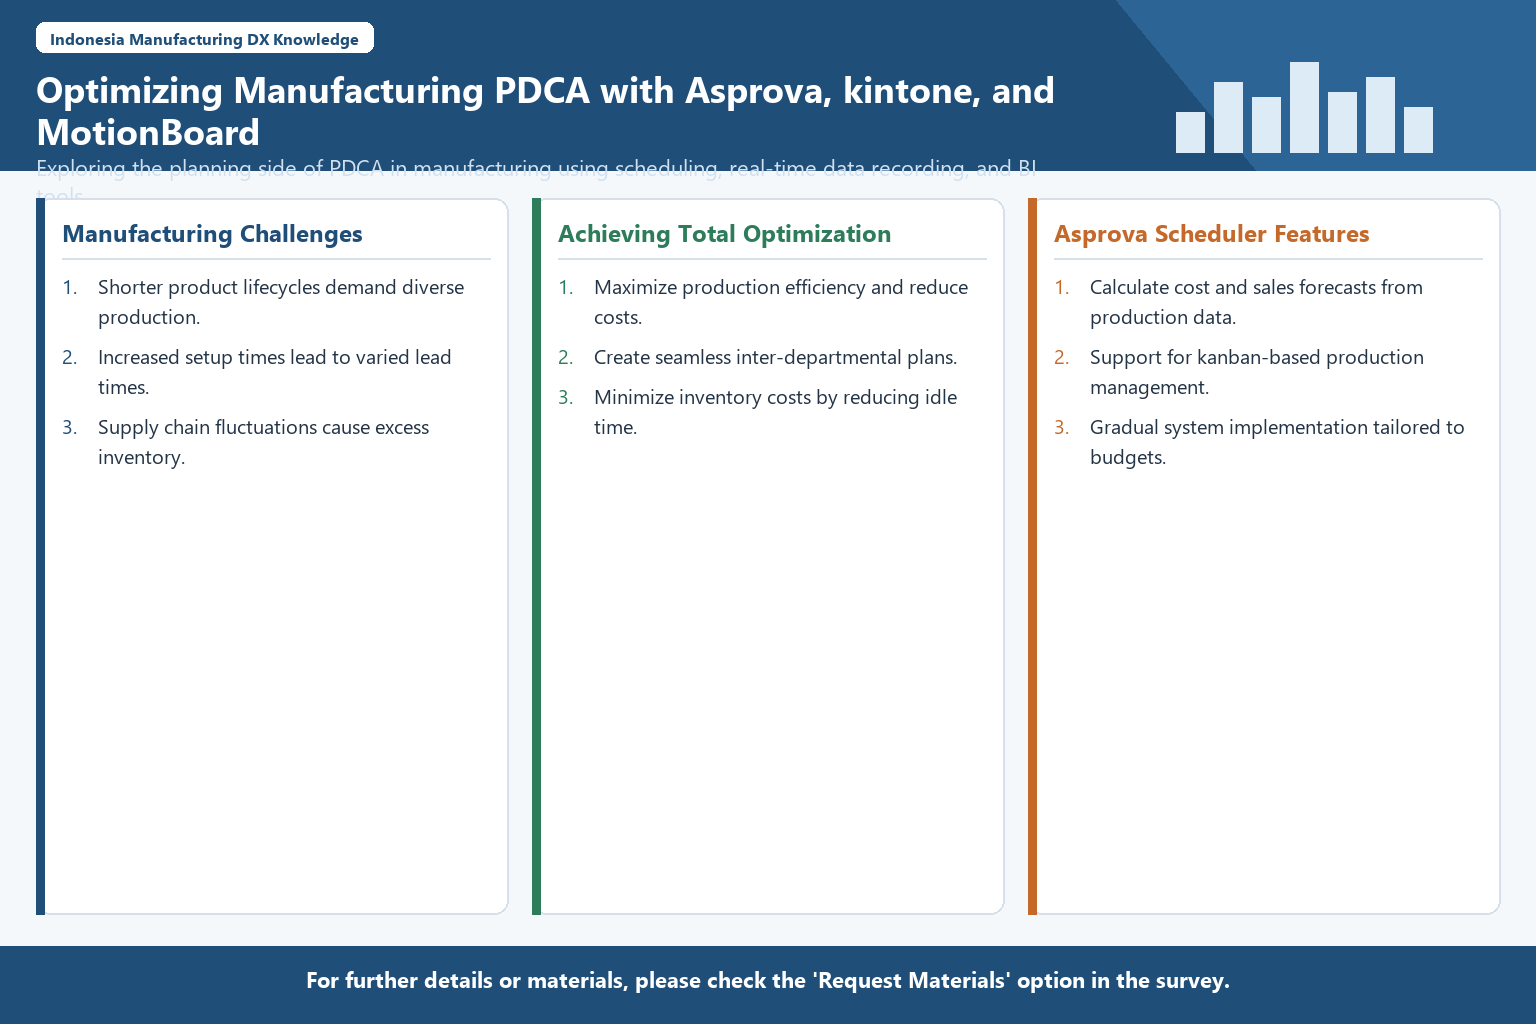
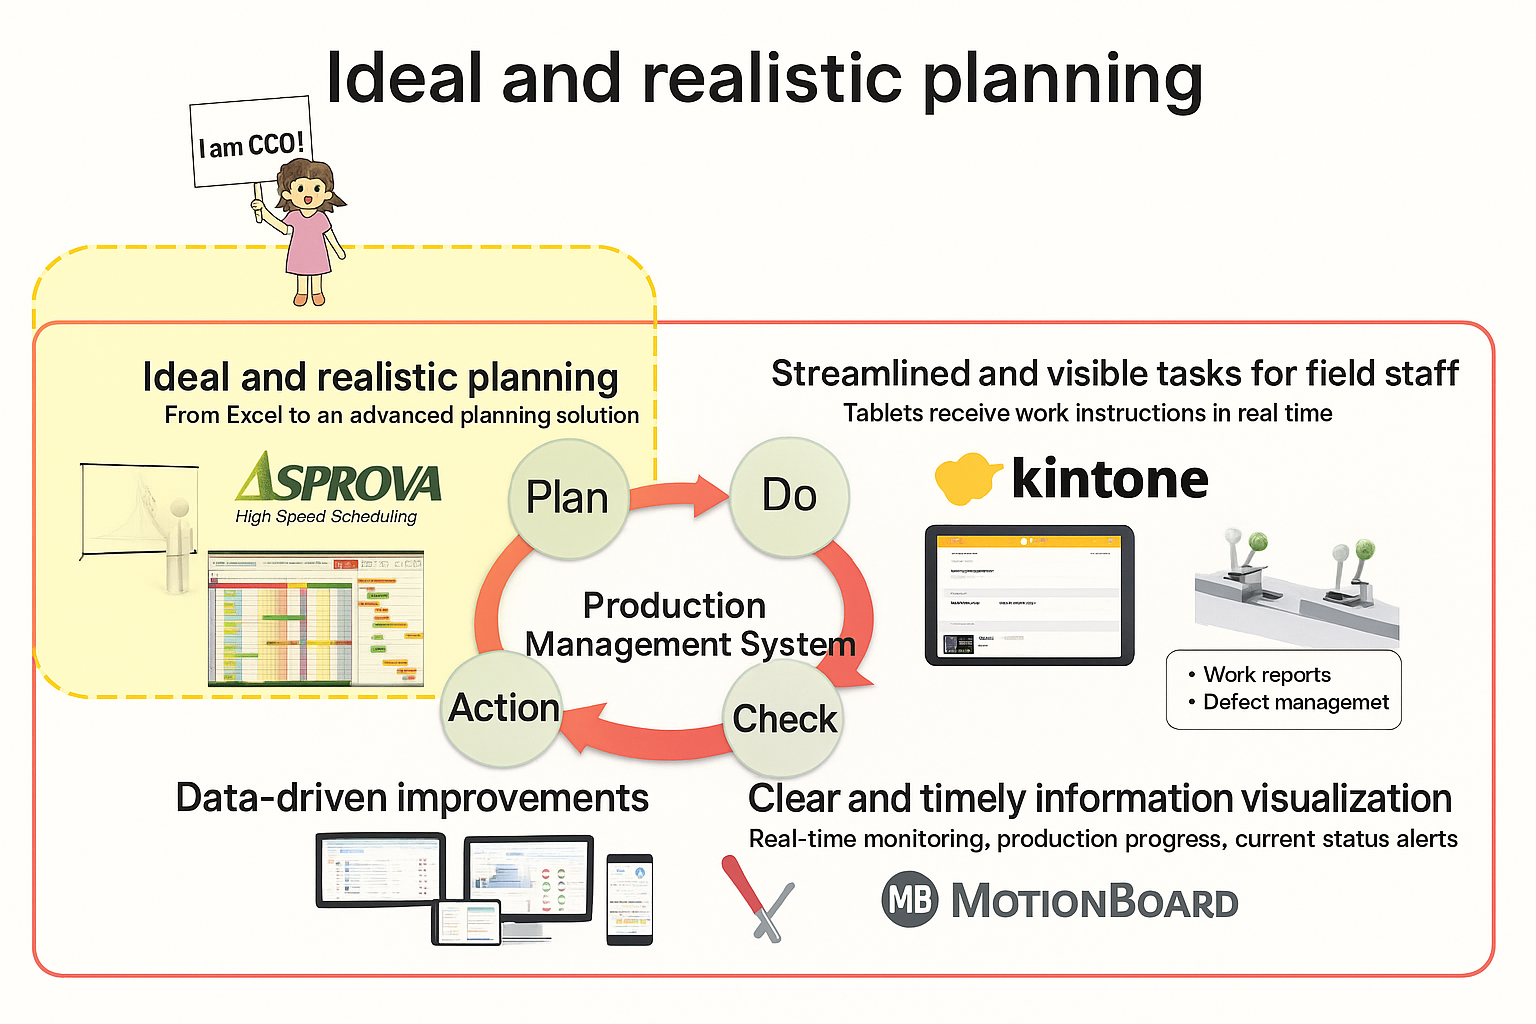
In the PDCA cycle of creating production plans with a production scheduler, recording manufacturing results on tablets, and visualizing plans and results with BI tools, we organize the thinking on the Plan (planning) side. My part mainly relates to manufacturing, but the content regarding Cybozu kintone and WingArc Motion Board can be applied to general business operations. If you need materials, please check 'Request Materials' in the survey options, and we will send them via email later.
-
-
Production Management Systems in Indonesia
The ultimate goal in manufacturing is to improve productivity and meet delivery deadlines. Understanding the differences between manufacturing cost, cost of…
続きを見る
What this article covers
- Cybozu kintone and WingArc Motion Board can be applied beyond manufacturing industries.
- Japanese factories in Indonesia require diversified small-lot production, necessitating process segmentation.
- On the shop floor, increased setup changes cause variability in production lead times.
- Total optimization requires seamless planning functions across departments.
- Inventory costs and opportunity loss risks are managed through demand forecasting accuracy and supply capacity.
Company Introduction
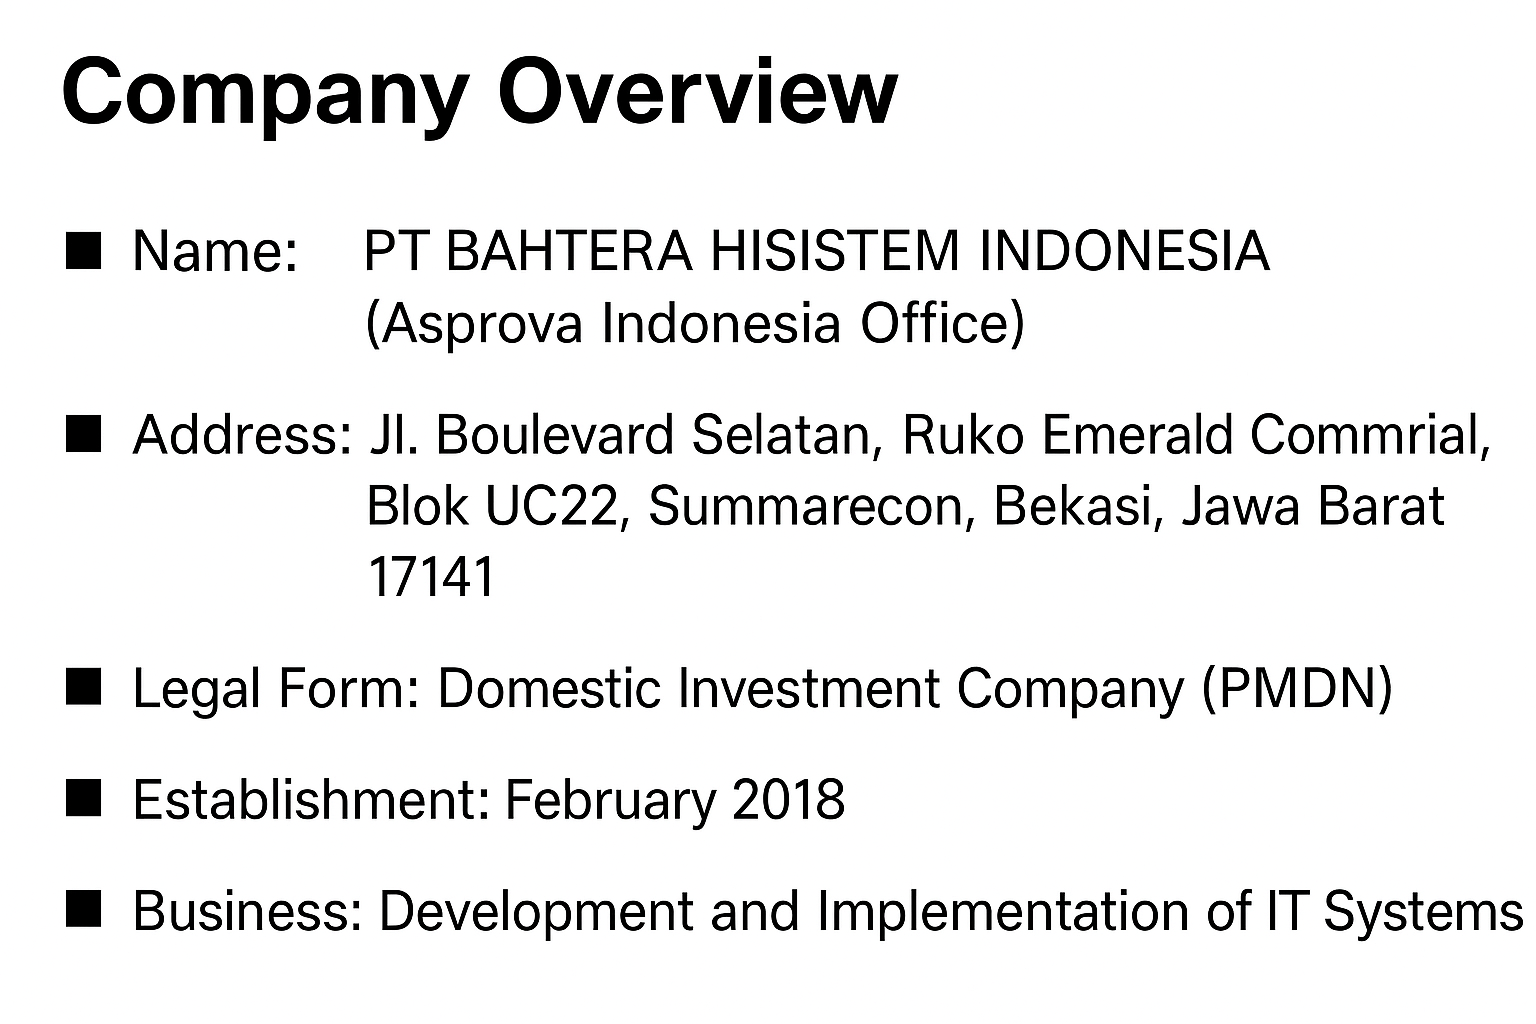 |
Let me briefly introduce our company. We are Bahtera High System, located in Summarecon, West Bekasi. Although we were established last year, I have been working in systems for about 20 years. |
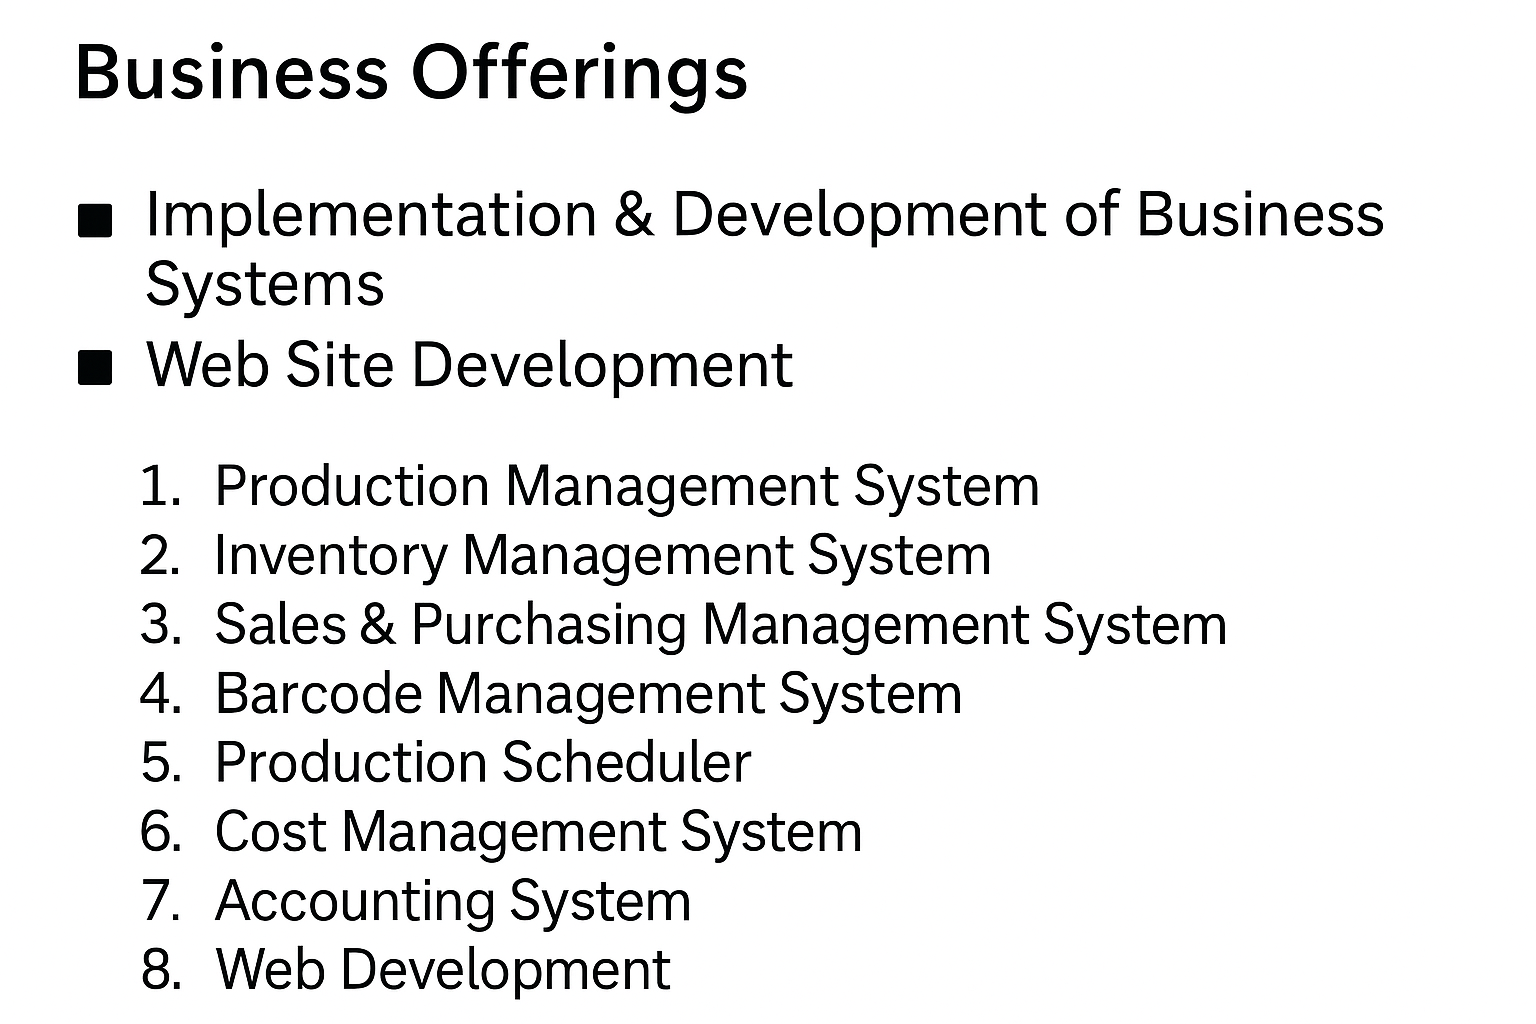 |
Our main business involves manufacturing systems, including production management, inventory management, sales and purchasing, production planning, cost calculation, and accounting. These systems aim to achieve efficient manufacturing processes by utilizing the latest technologies such as MRP, BOM, MES, and IoT. |
Challenges Faced by Japanese Manufacturers in Indonesia
Let's dive into the main topic, starting with the harsh environment faced by Japanese manufacturers in Indonesia, where 'visualization for total optimization' is necessary.
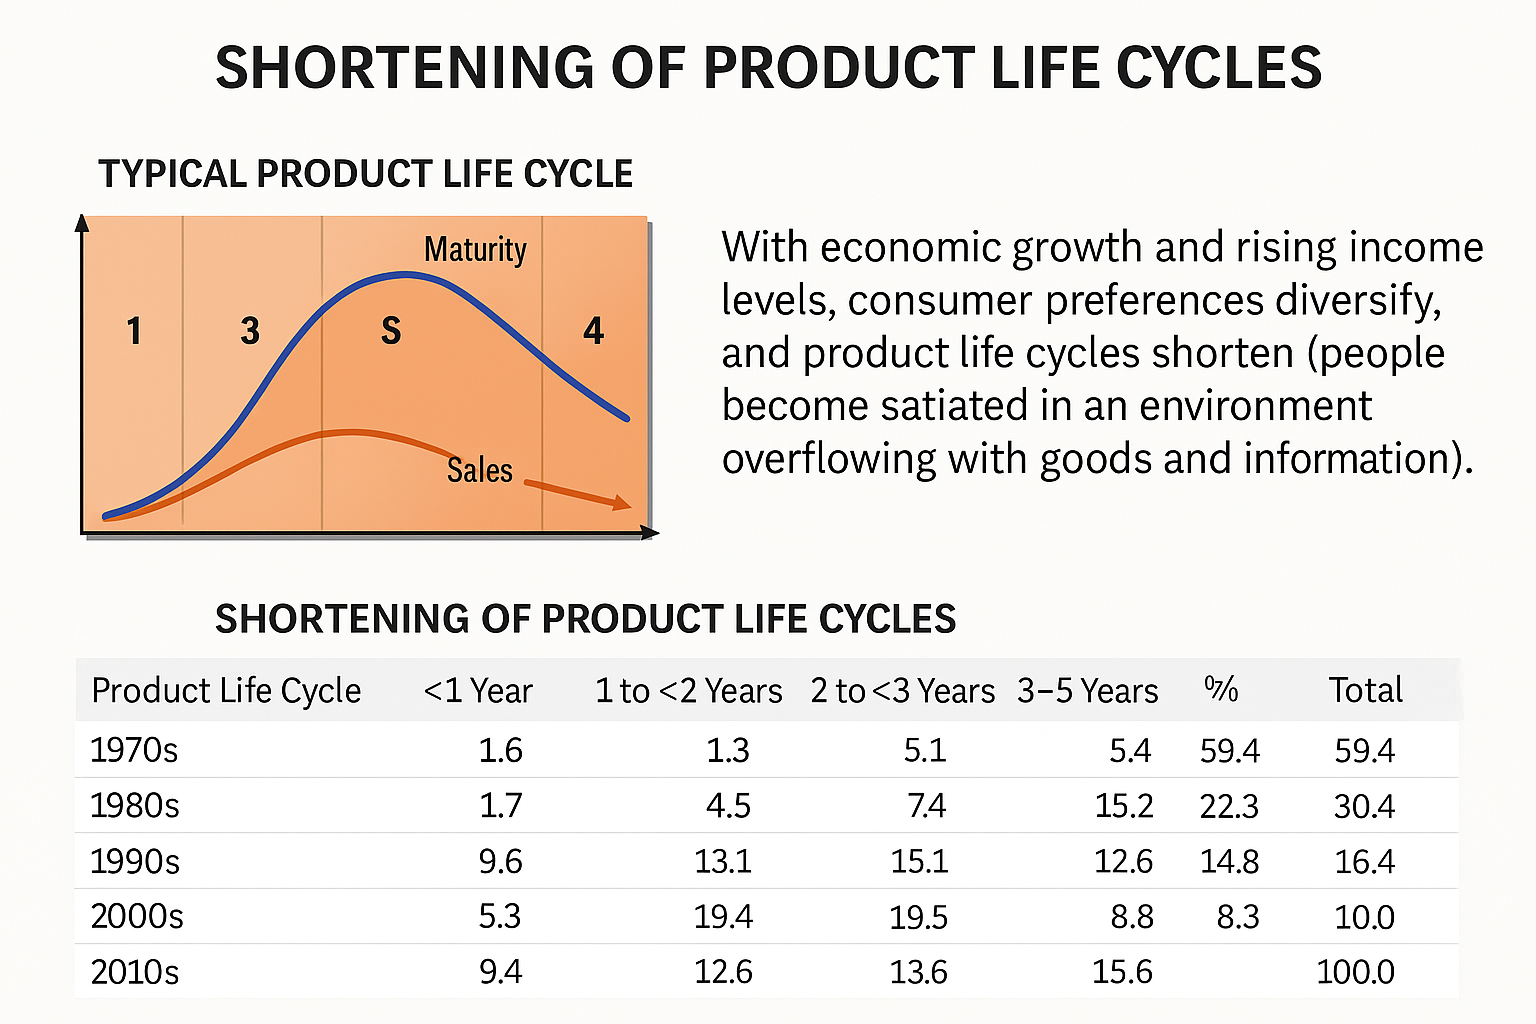 |
The shortening of product lifespans is an inevitable phenomenon as Indonesia's economic growth increases consumer income levels, leading to higher consumption desires and diverse preferences. Recently, as Indonesian salaries rise, it's common to see Indonesian families ordering lavish meals at restaurants, indicating increased wealth. Macroeconomically, Indonesia's economy is often described as 'moderate growth,' but this is due to the inability to add value through domestic processing, resulting in a trade deficit. However, the increasing consumer population compensates for this, driving gradual growth. |
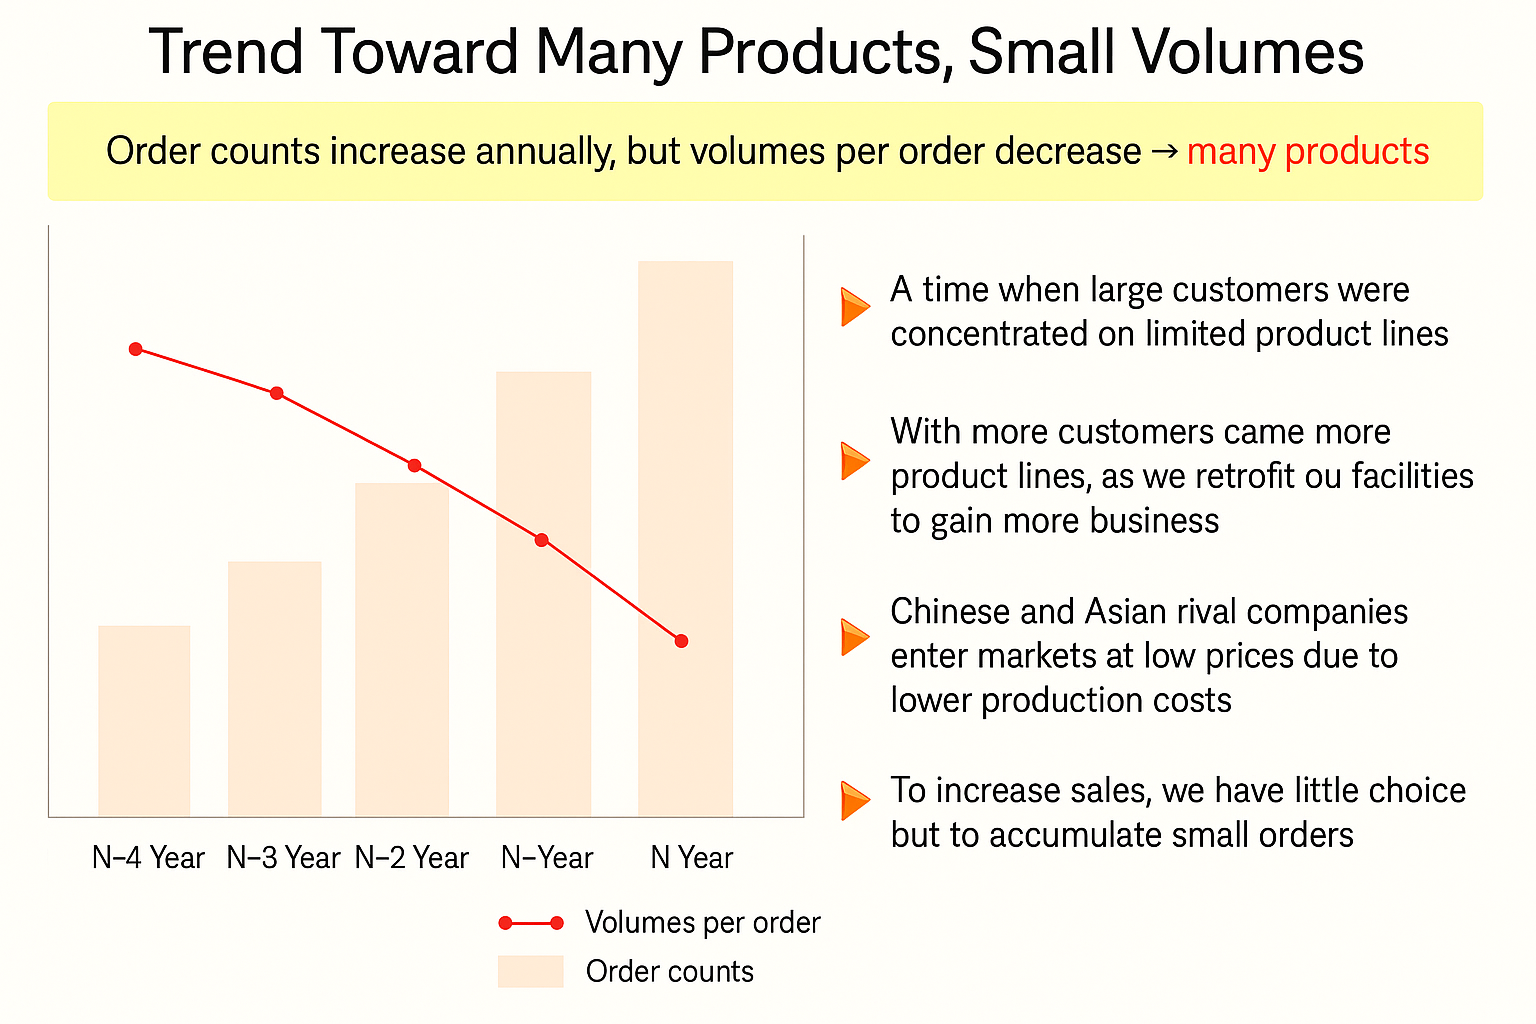 |
The shortening of product lifespans demands diversified small-lot production from manufacturers. About ten years ago, many factories focused on delivering large-lot products to major customers on time. However, recently, the proportion of sales to major customers has decreased, making it difficult to maintain performance without accumulating small-lot orders. This trend is influenced by the tendency of companies to increase local procurement rates and intensified competition with rival companies from China and other countries. |
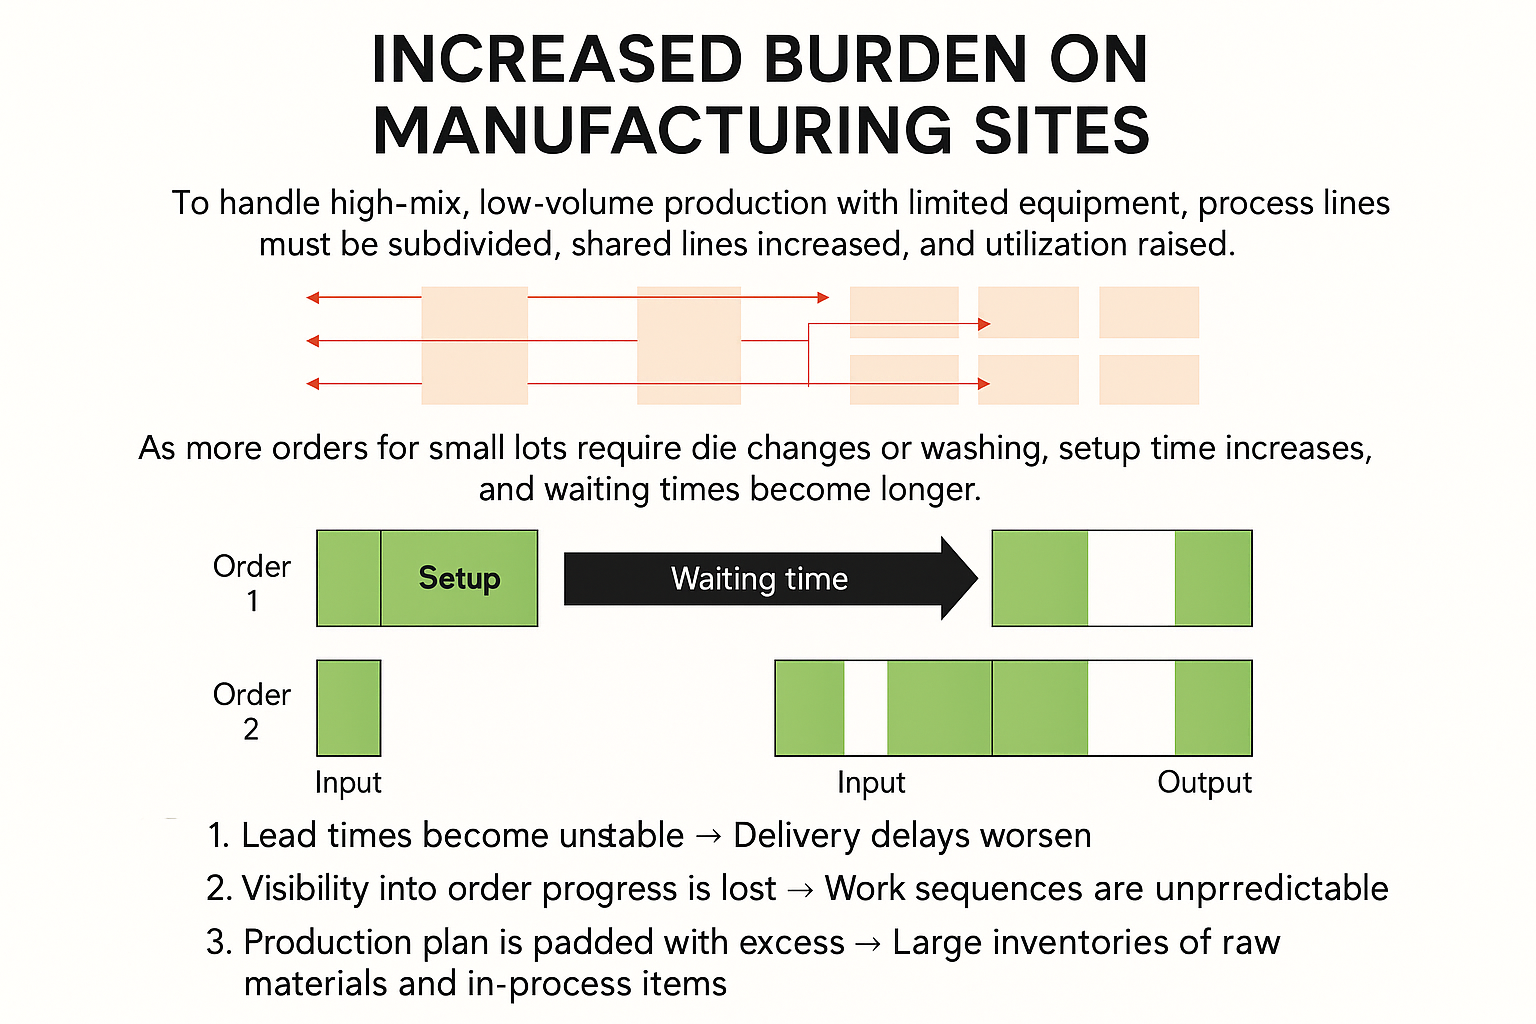 |
When responding to diversified small-lot production, it is necessary to subdivide process lines and increase shared lines to raise the operating rate of limited production equipment. However, the smaller the lot size, the more setup changes and cleaning are required, increasing waiting times between processes depending on the item, quantity, and line congestion. As a result, production lead times vary by product, worsening on-time delivery rates, making it difficult to see the connections between processes and the order of operations, leading to excessive inventory purchasing plans to prevent line stoppages due to material shortages. |
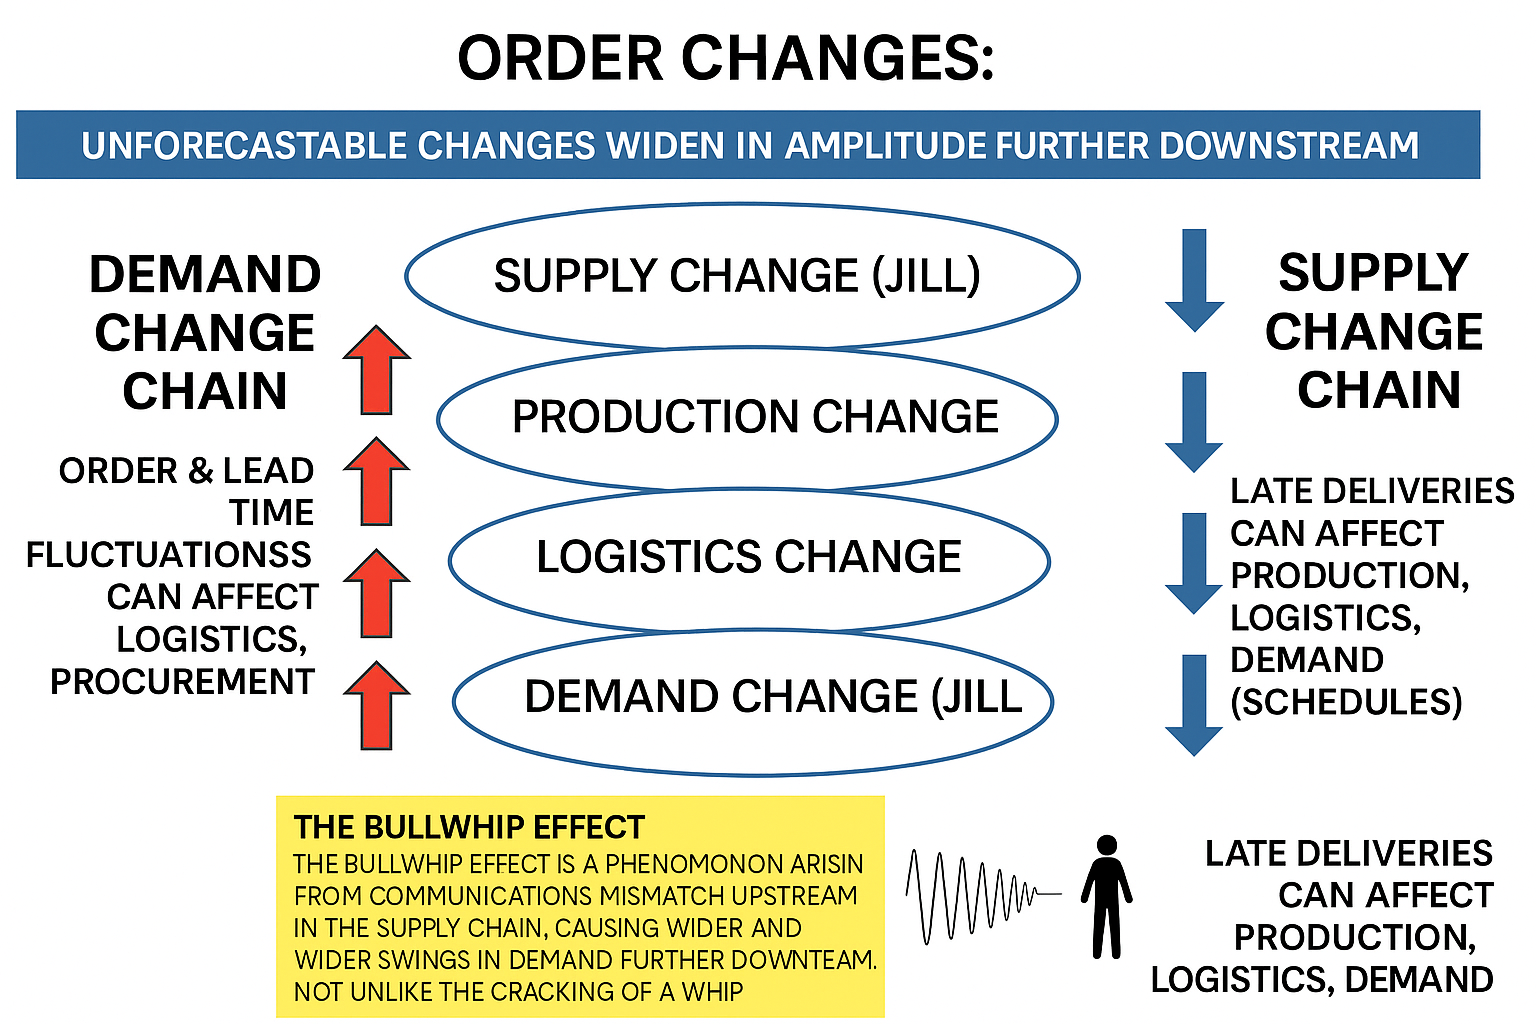 |
As the number of customers increases, various demands arise, including unreasonable order changes from some customers and suppliers who do not meet delivery deadlines. In the supply chain, the upstream side refers to raw material suppliers, and the downstream side refers to those closer to the final consumer. Demand fluctuations downstream have a ripple effect upstream in the supply chain, and supply fluctuations upstream flow downstream with a ripple effect. This phenomenon, where the ripple effect increases as you go further down the flow, is compared to the whip effect, known as the Bullwhip Effect. |
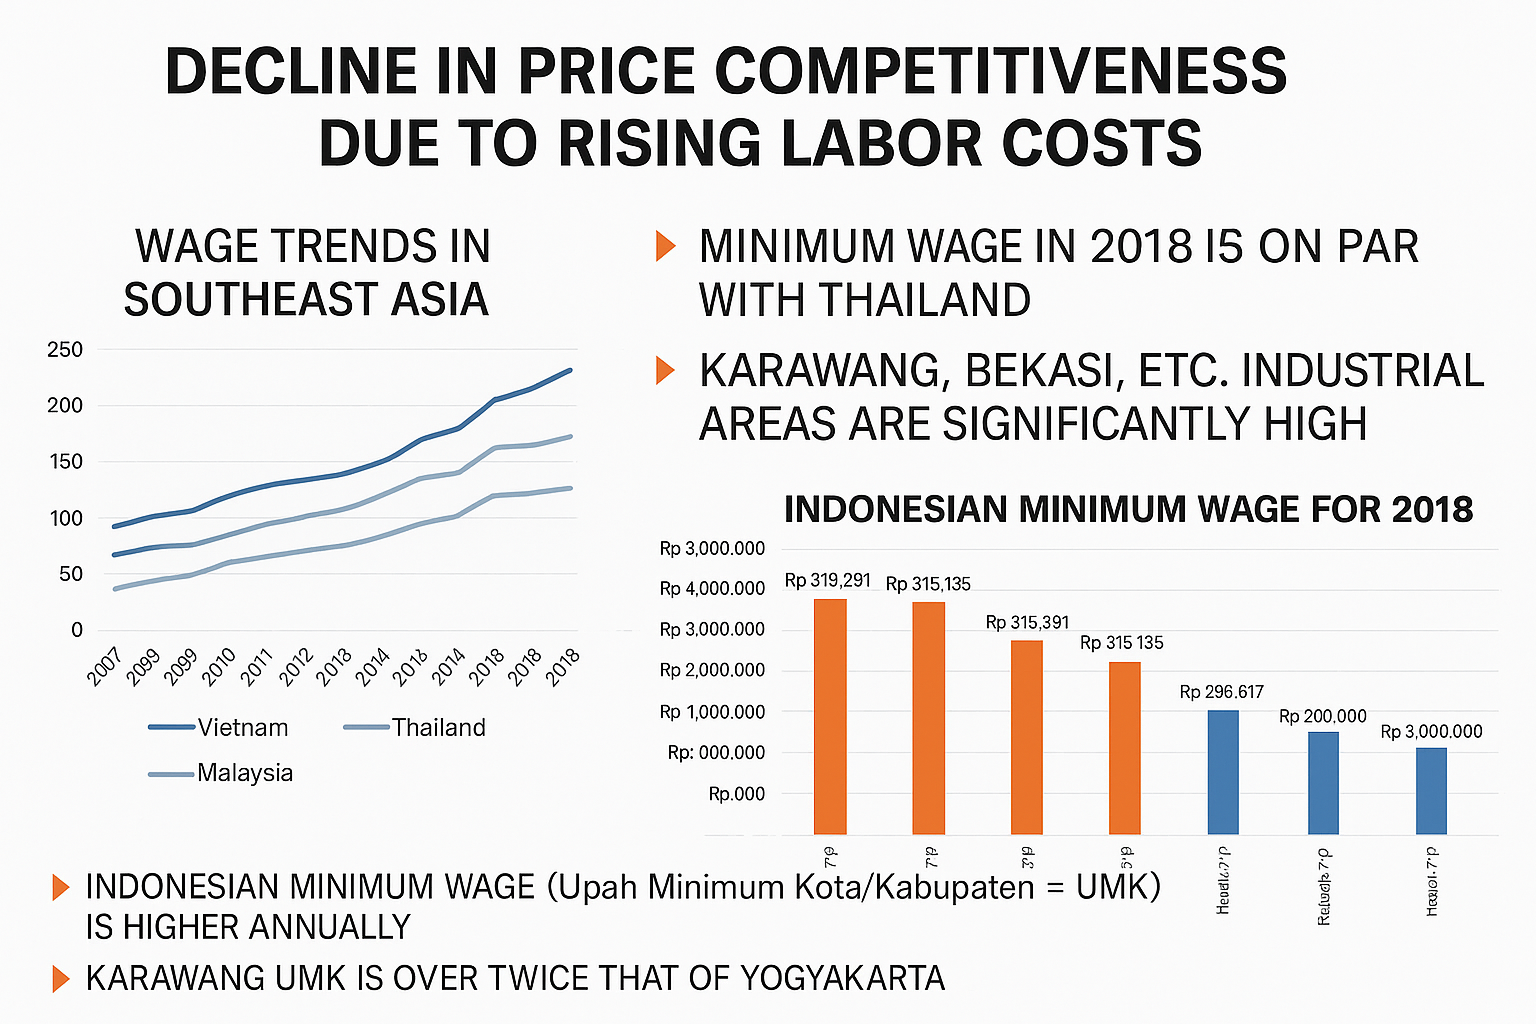 |
Since the inauguration of the Jokowi administration in 2014, labor costs have continued to rise due to excessive consideration for labor unions, but recently, the inflation rate has settled below 5%, and demonstrations demanding higher minimum wages seem to have decreased. However, the minimum wage in Bekasi Regency remains at the highest level in Indonesia, nearly twice that of Central Java. |
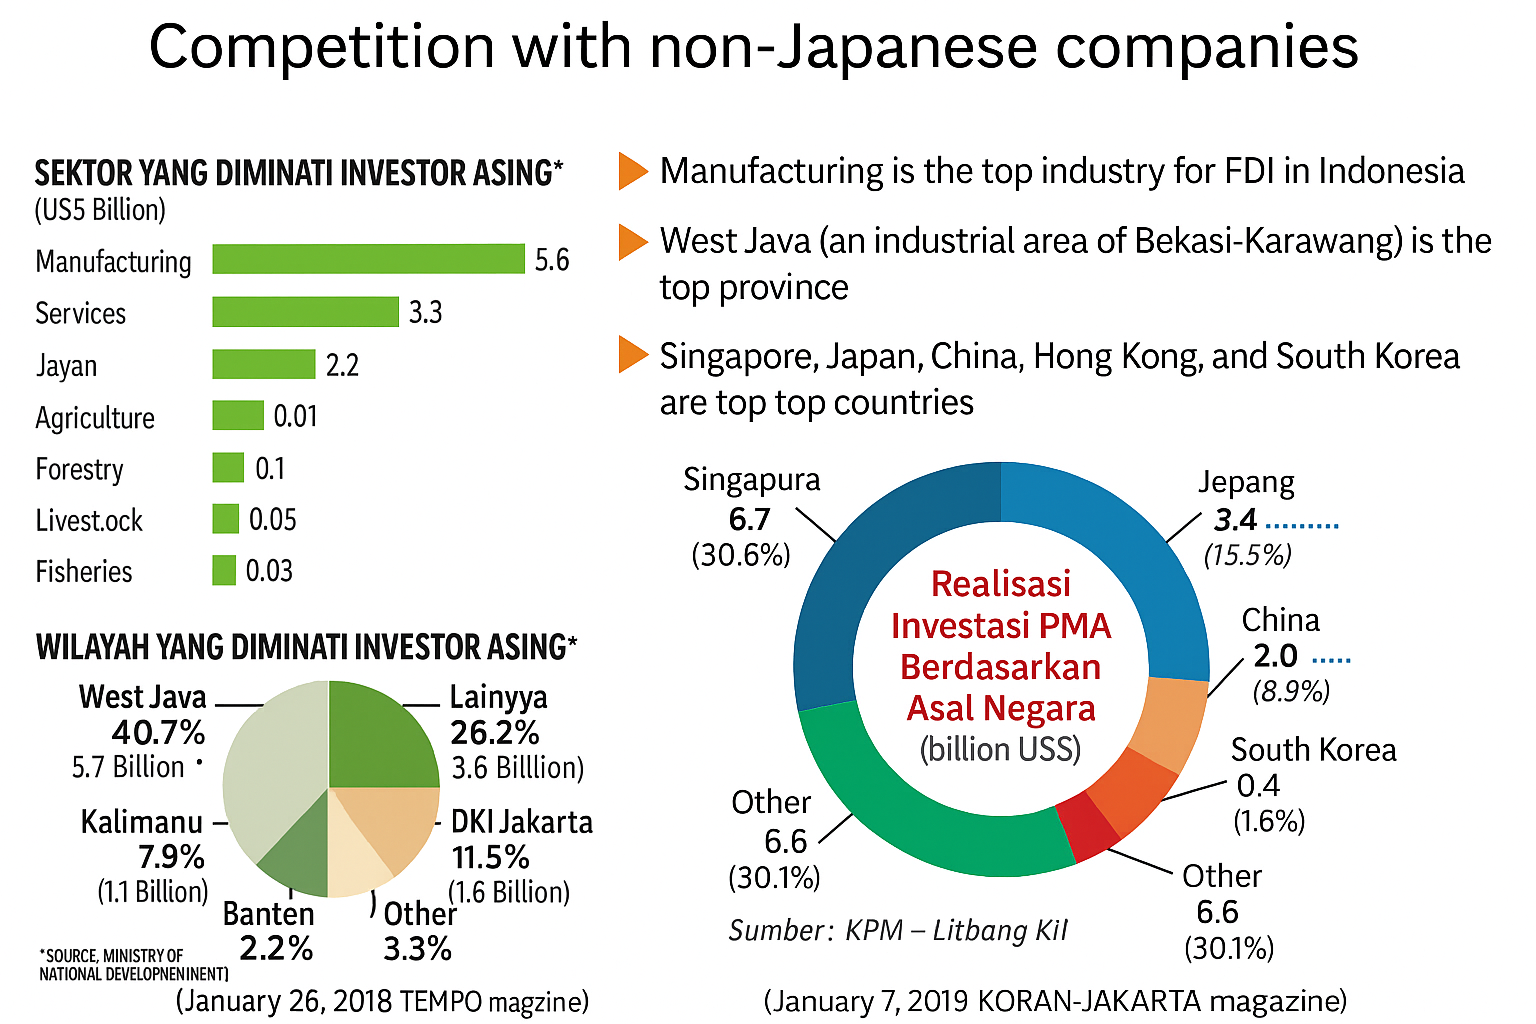 |
It is said that more than 7 million people are employed by Japanese-affiliated companies in Indonesia, ranking second in investment by country after Singapore. Under the Suharto administration, the contribution of manufacturing to GDP was over 20%, but it has now fallen to 16%. The second term of the Jokowi administration, which began this year, aims to raise this to 25% and promote the attraction of downstream industries that add value to raw materials. |
Shifting from Partial to Total Optimization for Productivity Improvement
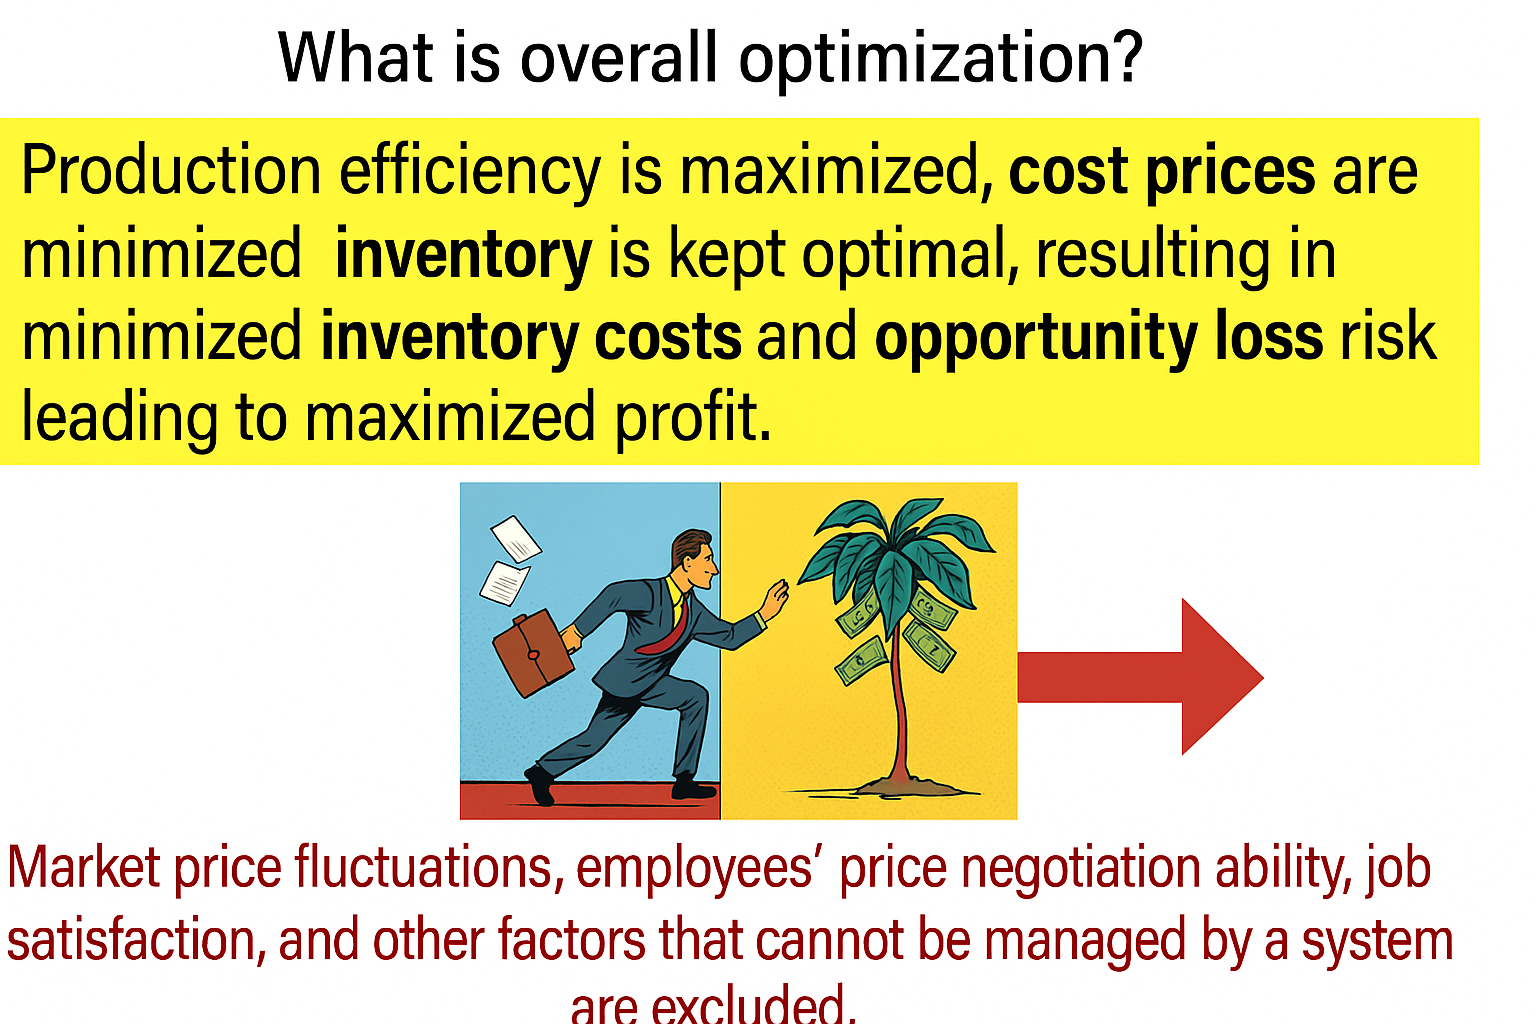
To address the harsh realities faced by Japanese manufacturers, a shift from partial to total optimization is required. Total optimization involves maximizing production efficiency, reducing unit time costs, and minimizing inventory costs to maximize profits. It excludes elements that cannot be managed by the system, such as market price fluctuations and price negotiations.
|
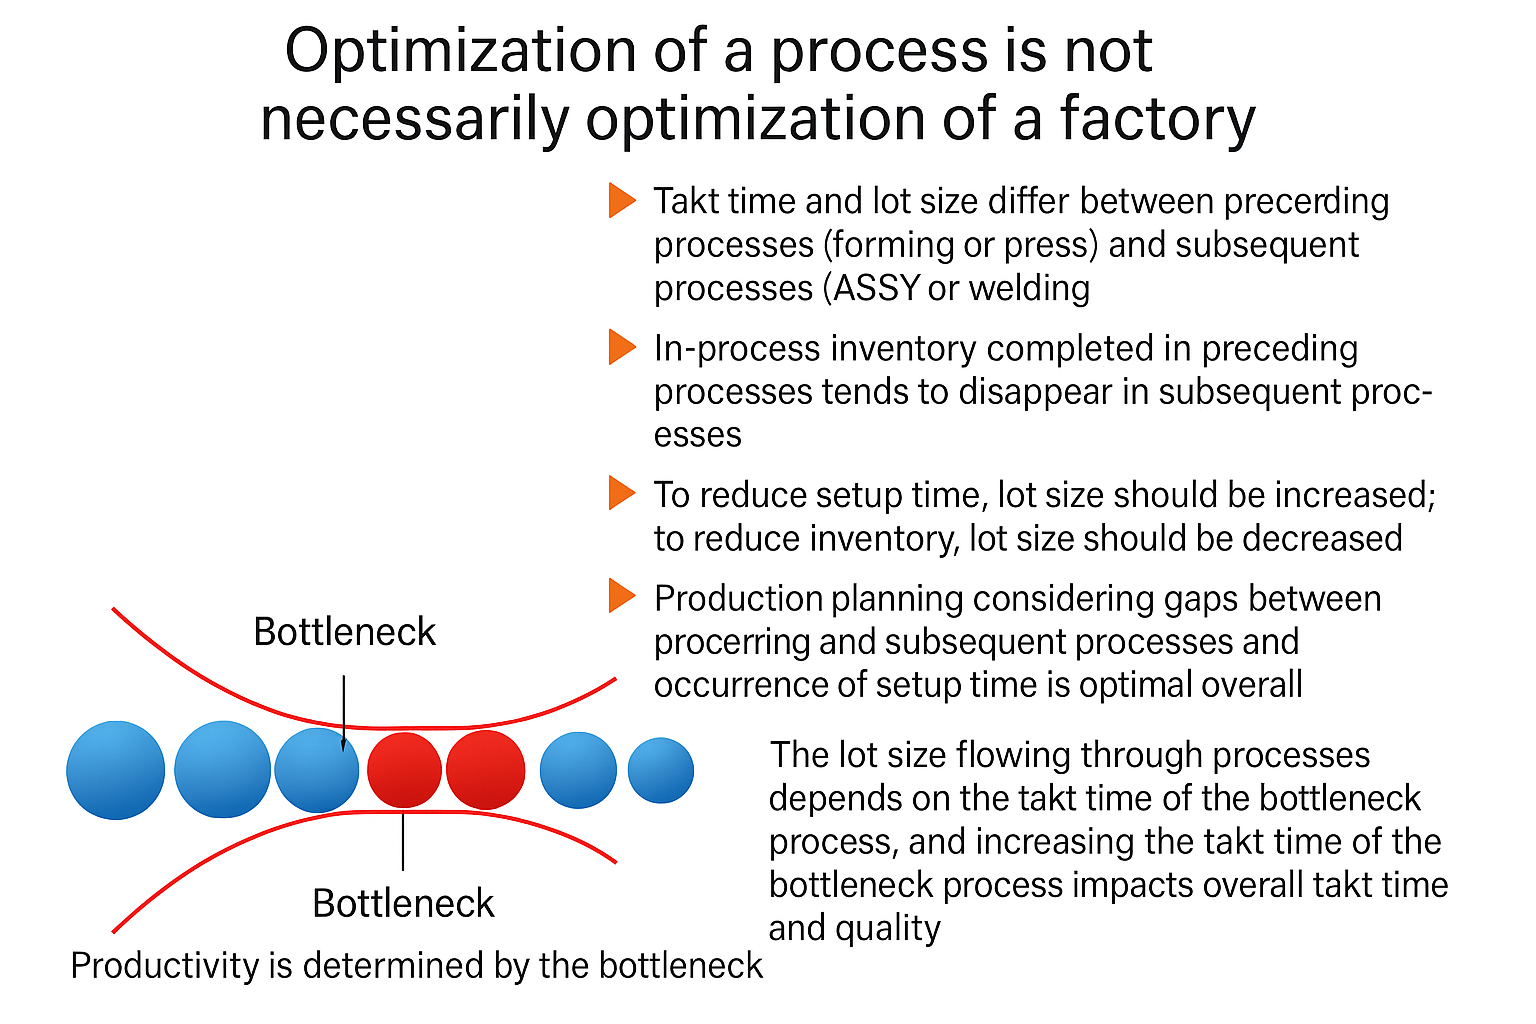
In Indonesian factories, the front process is often molding or pressing, and the subsequent process is ASSY or welding. Due to differences in takt time, it is common to consume intermediate inventory produced in the front process in the subsequent process. The overall production capacity of the factory depends on the bottleneck process capacity, so it is important to align the takt of the front and subsequent processes to prevent inventory stagnation and reduce inventory costs. |
 |
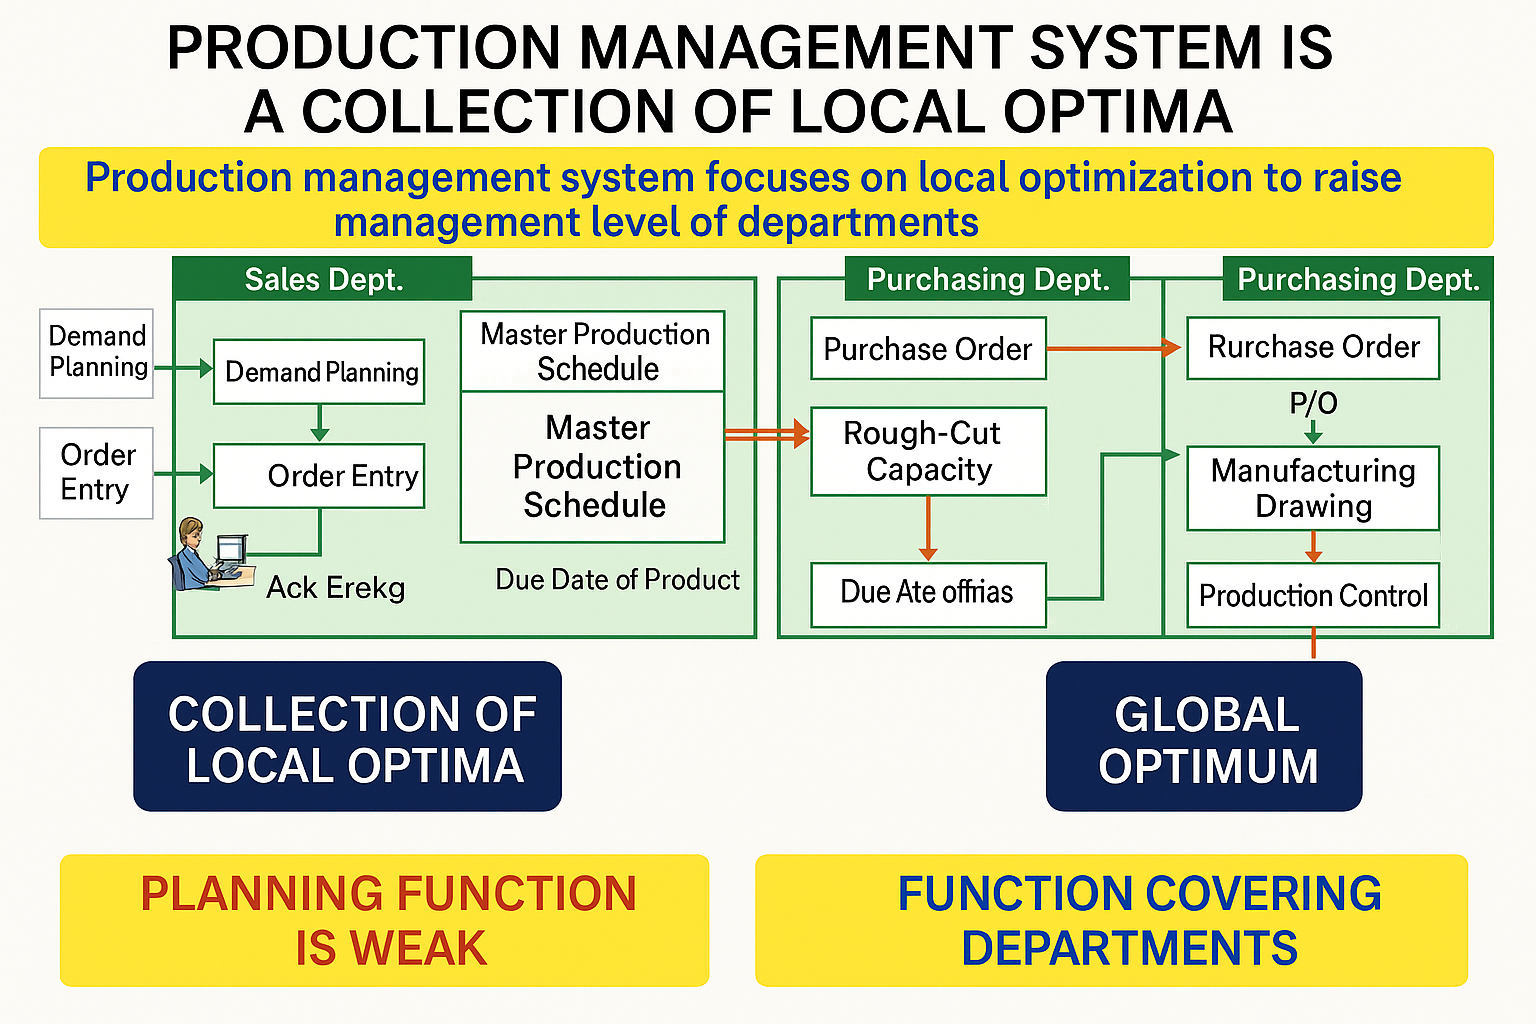
General production management systems are based on departmental optimization and are a collection of partial optimizations. Total optimization requires a function to create plans that seamlessly integrate between departments. |
 |
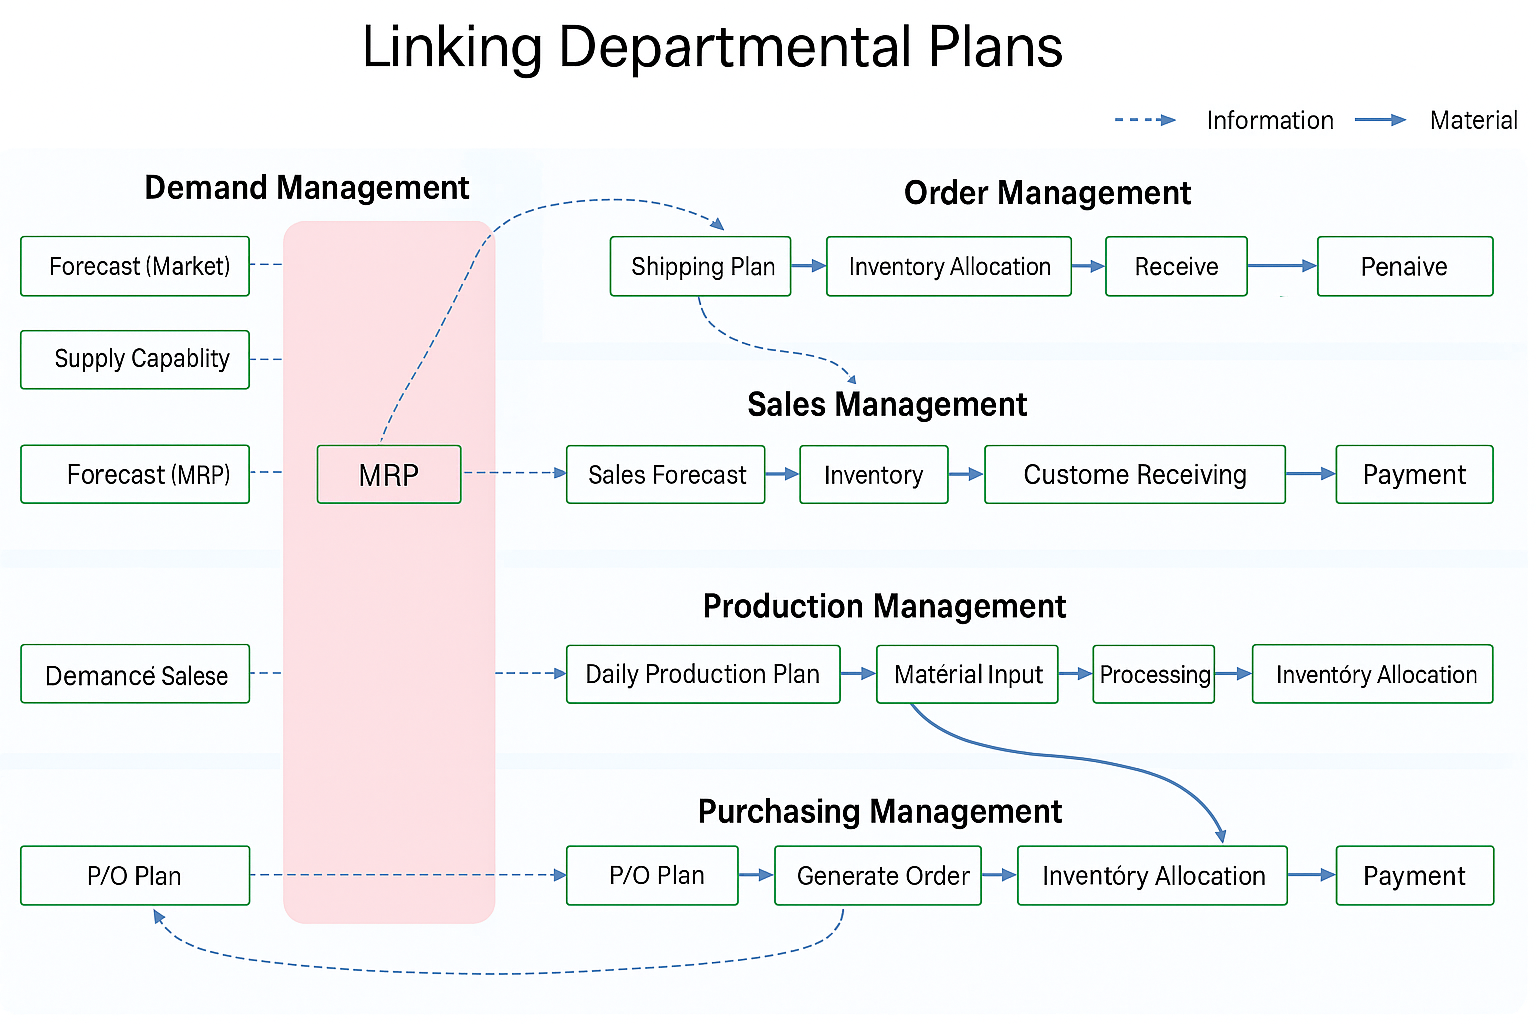
Within the company, there are departments such as sales, production, and purchasing under management, and plans are created based on the demand and supply of each department. For total optimization, it is important that plans for each department are seamlessly created. |
 |
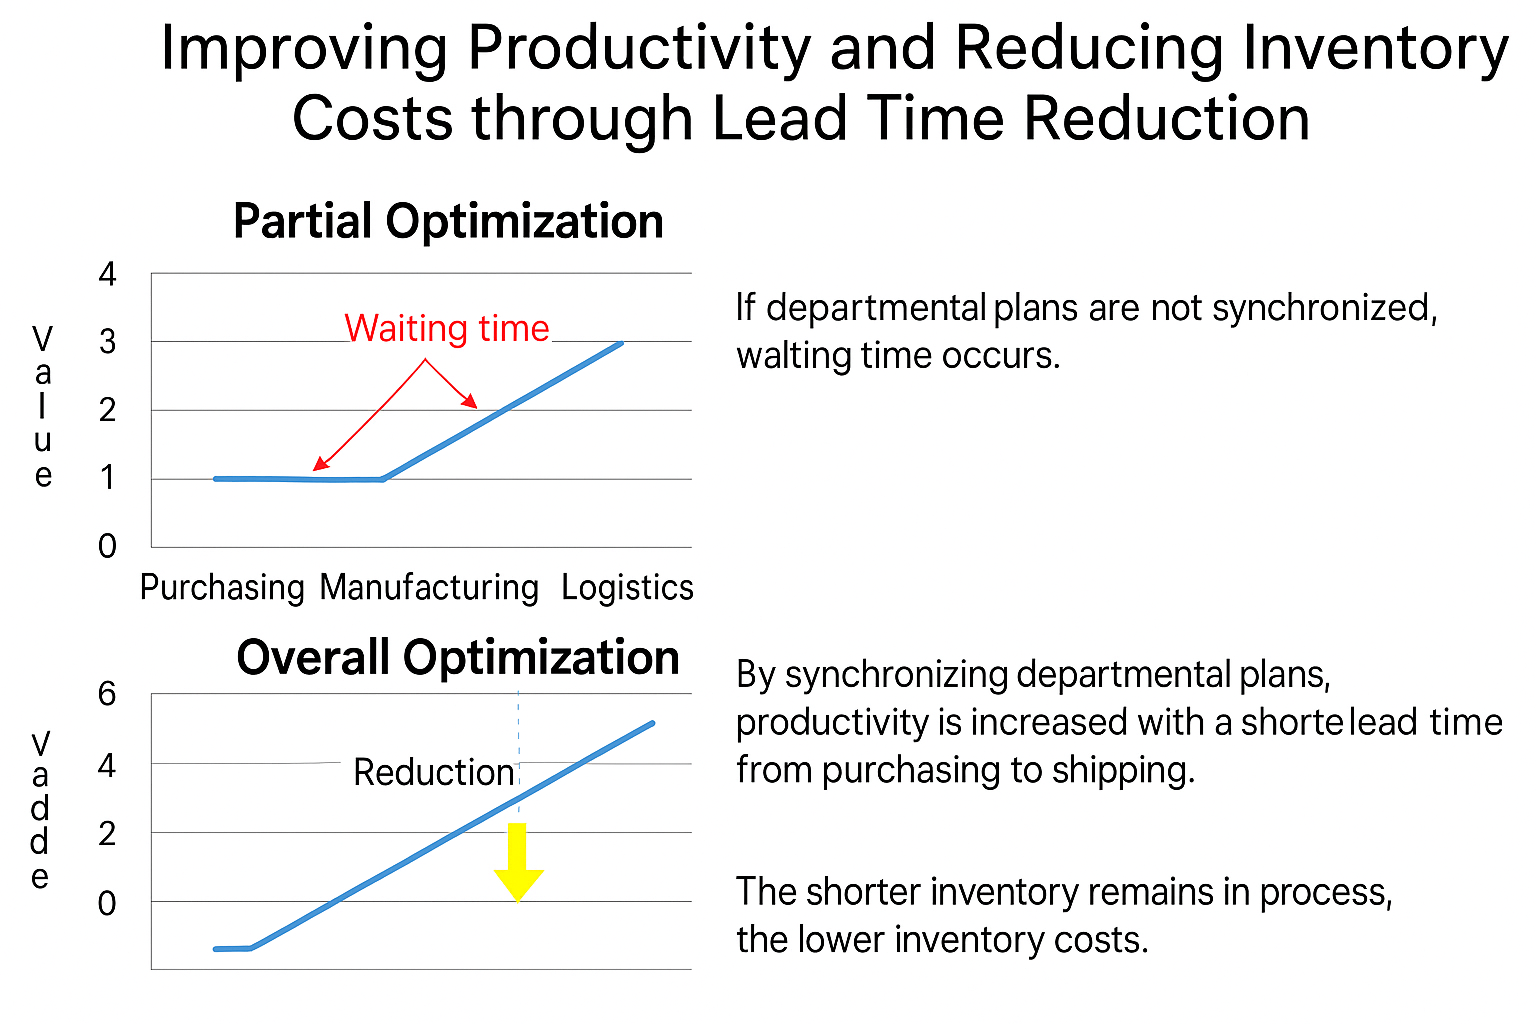
Waiting times between departments lengthen lead times, and product stagnation in warehouses increases inventory costs. If operations flow according to synchronized plans between departments, the time products remain within the company is shortened, reducing inventory costs. |
 |
Planning shows how economic activities are conducted by adding value to products and information from upstream raw material manufacturers to downstream final consumers, centering on the company's factory within the supply chain. |
Inventory Costs and Opportunity Loss Risks
To achieve total optimization, it is important that departmental plans are consistently established. This allows for the reduction of inventory costs and opportunity loss risks, enabling the achievement of optimal inventory levels.
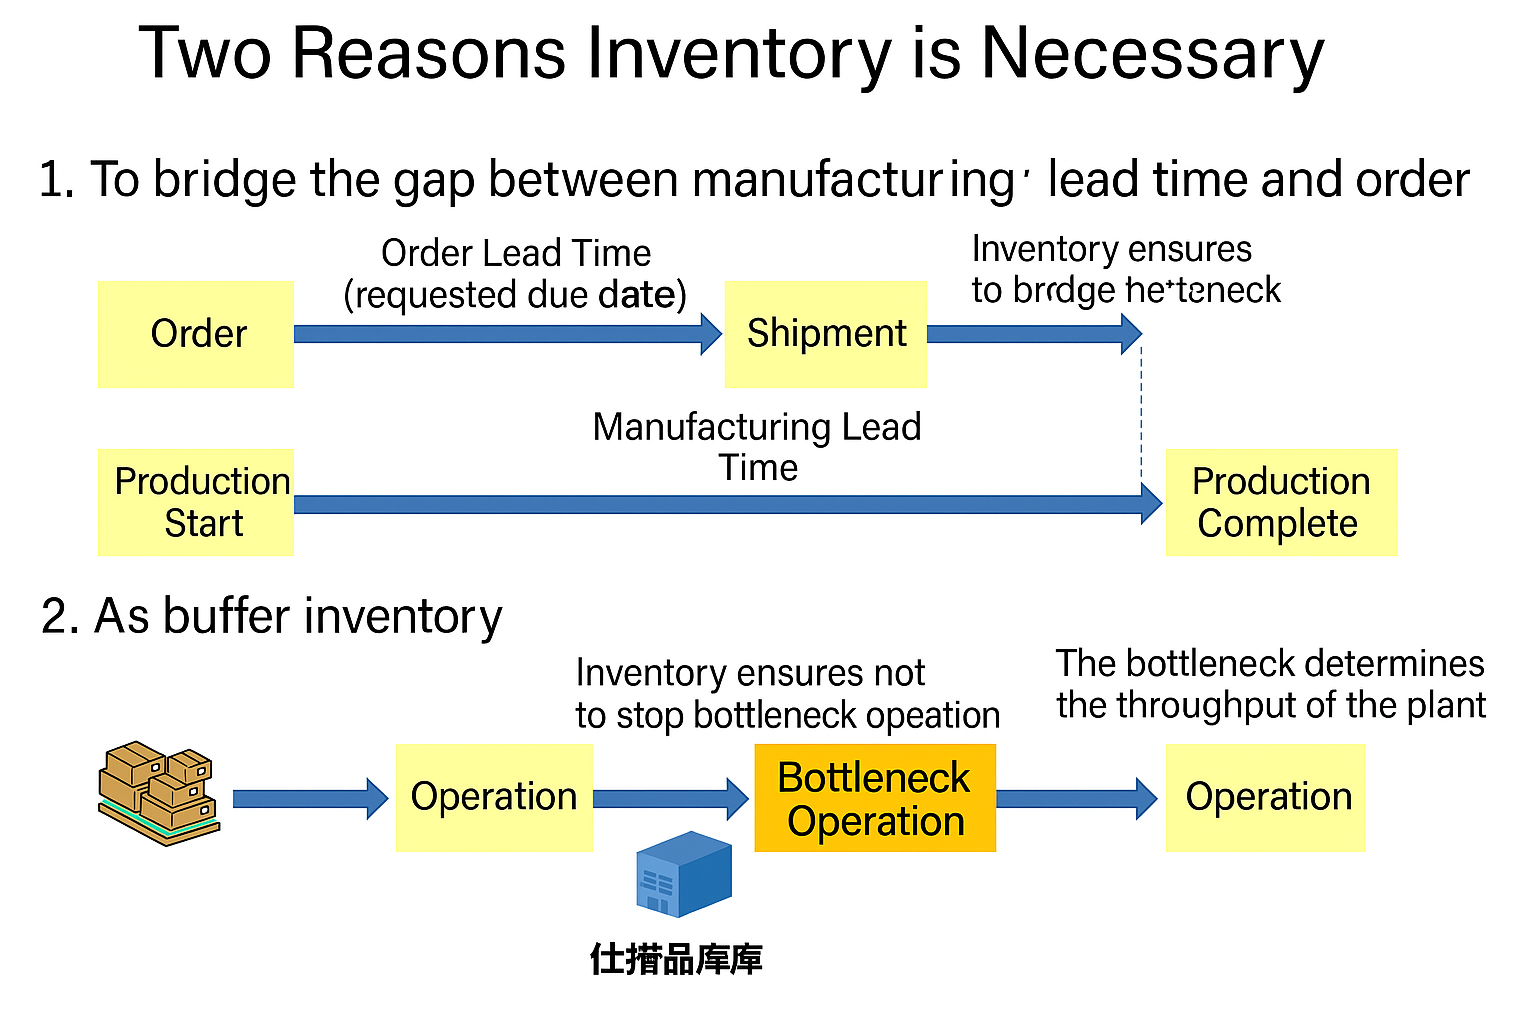 |
Inventory serves as insurance to bridge the gap between order lead time and manufacturing lead time. For example, if it takes 10 days to manufacture a product that needs to be shipped in 5 days, inventory is necessary. It also acts as a buffer to maximize the operating rate of bottleneck processes. |
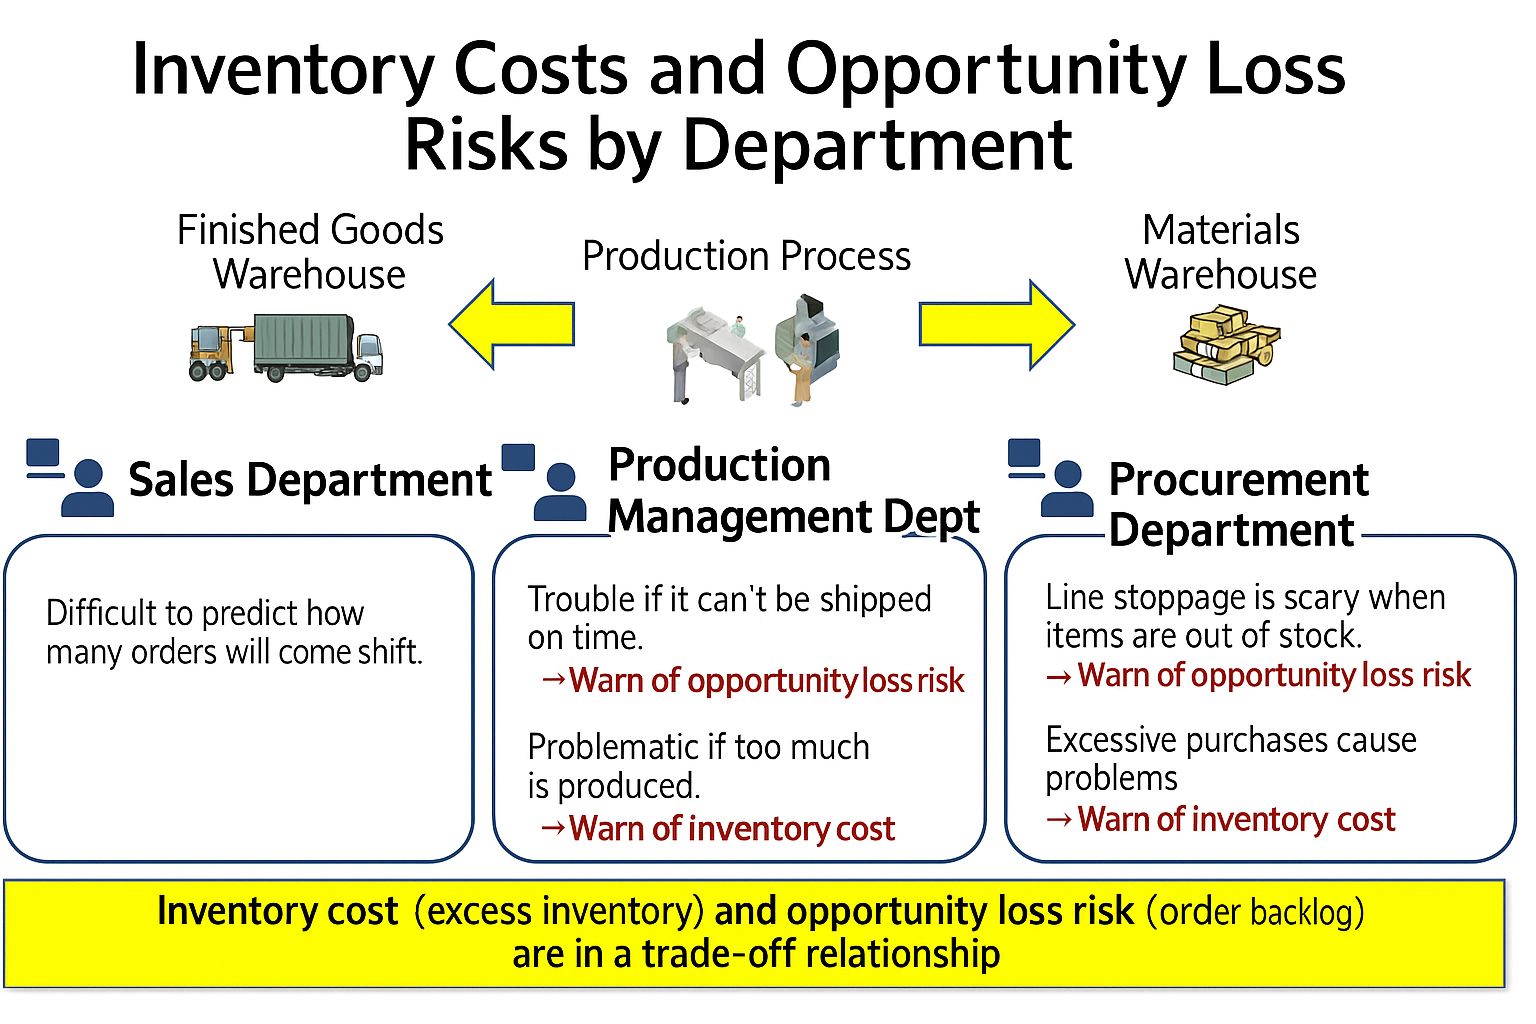 |
Departmental staff conduct operations while considering inventory costs and opportunity loss risks. Inventory costs and opportunity loss risks are in a trade-off relationship. |
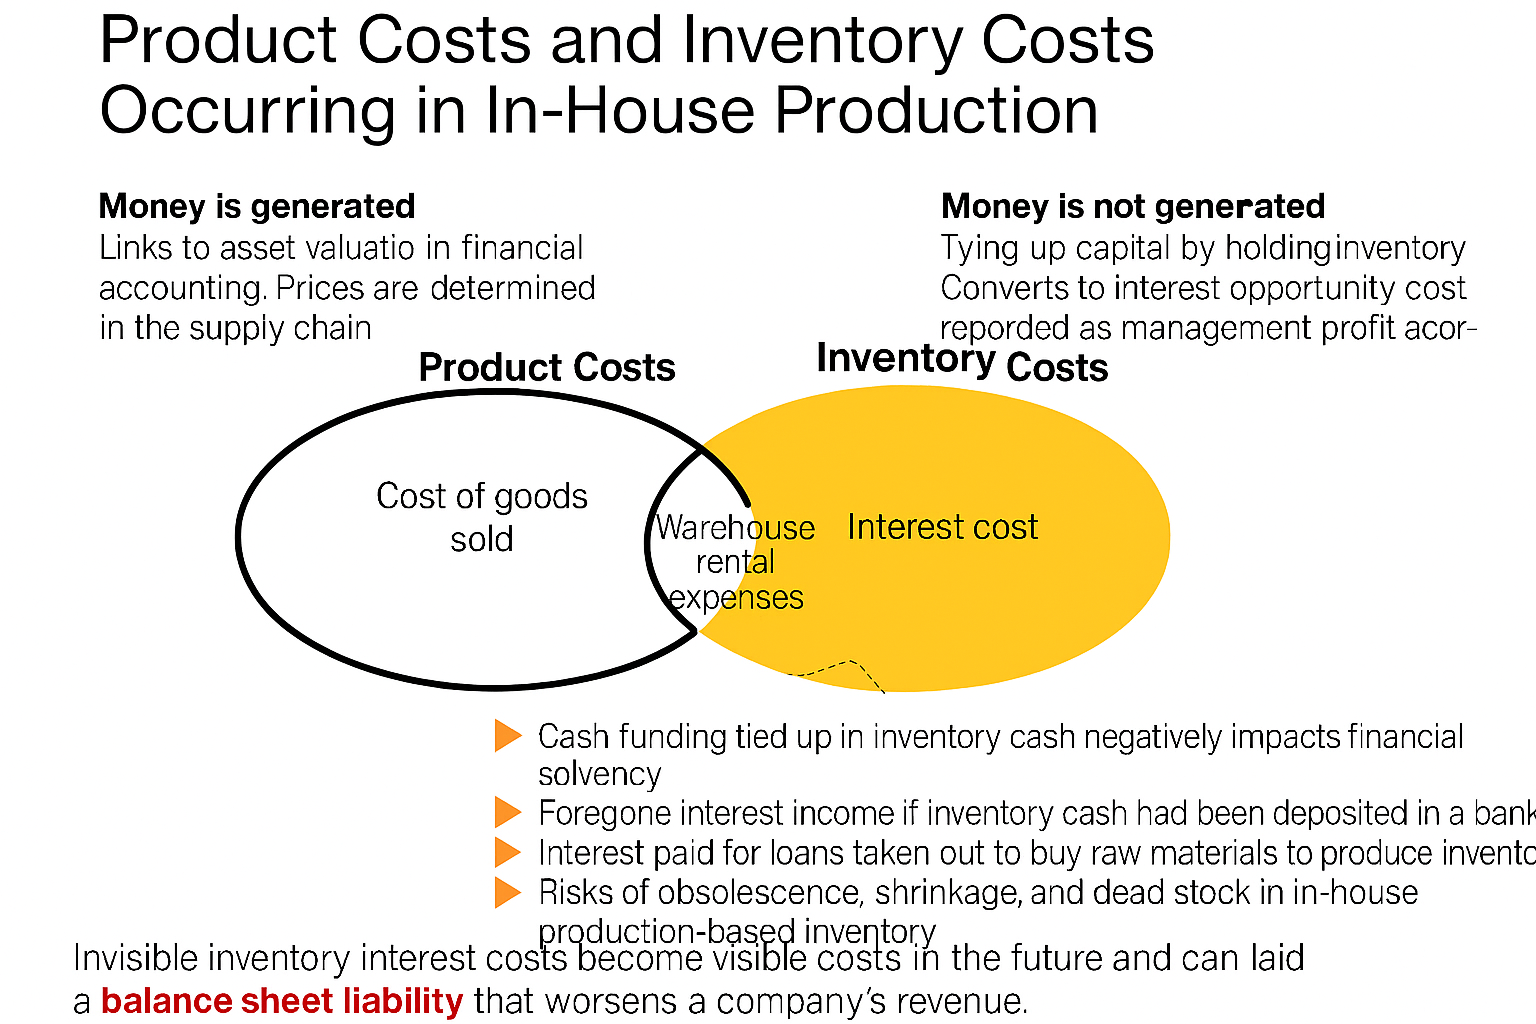 |
The cost of added value within the supply chain is accounted for as product costs, but the interest from inventory stagnating within the company occurs off-balance. The hypothetical value of how much revenue would have been generated if this inventory were held as cash within the company is the opportunity loss. |
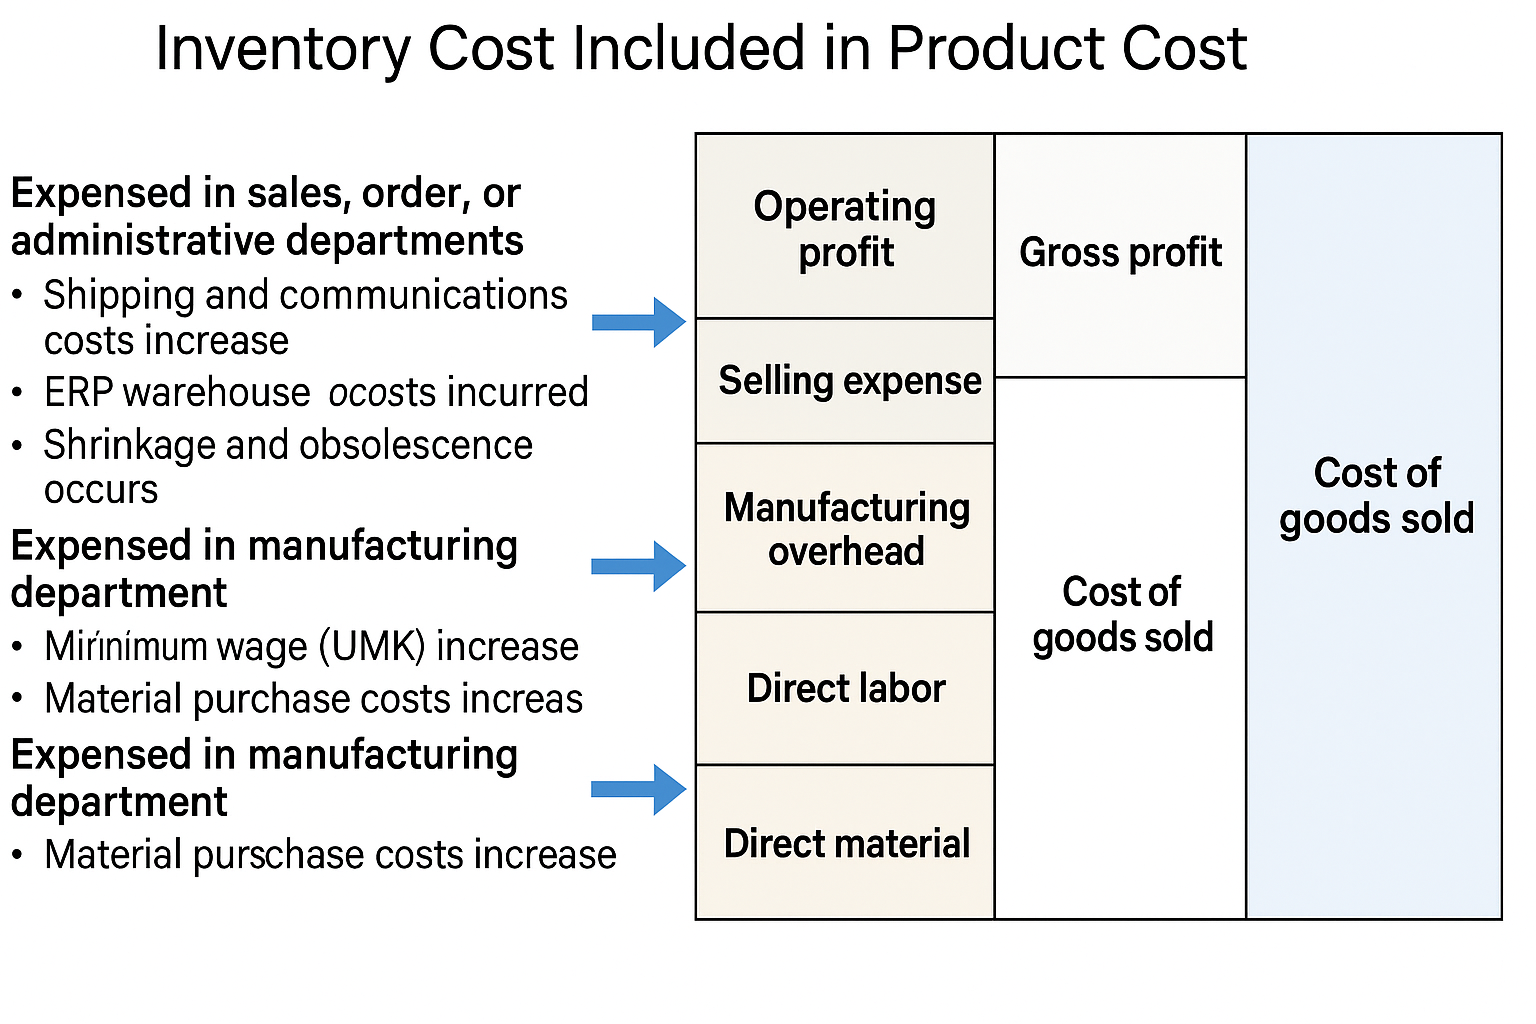 |
Product costs consist of manufacturing costs and selling and administrative expenses, with the difference from sales recorded as operating profit. Inventory shrinkage and warehouse rental costs are product costs and also represent interest from inventory. |
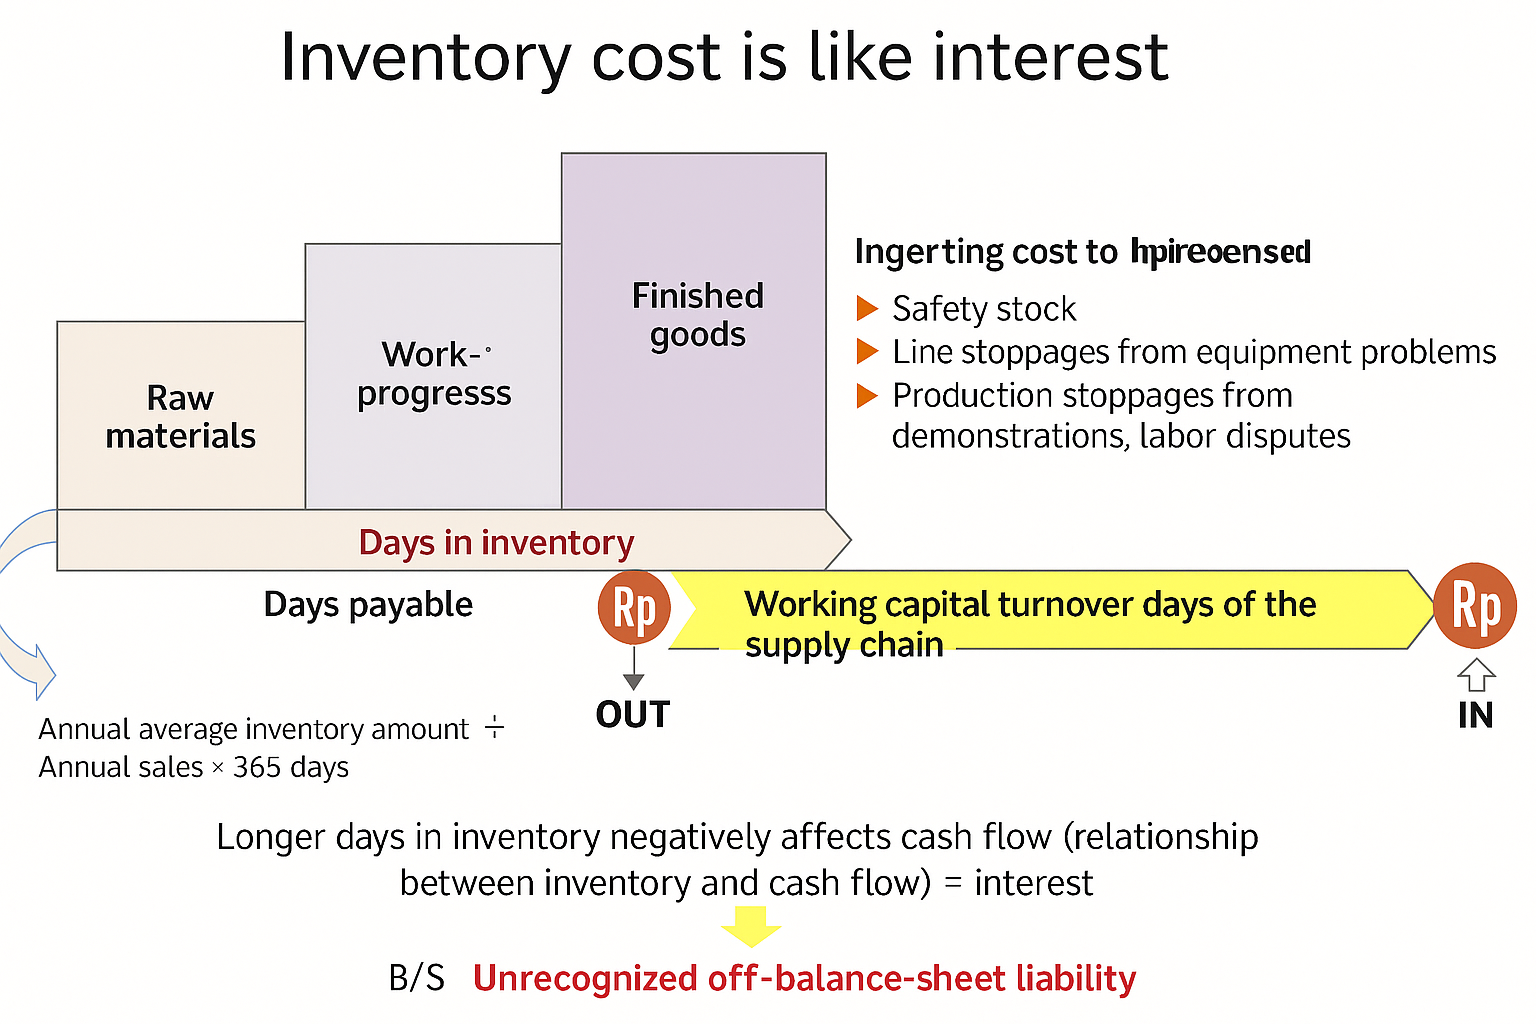 |
To estimate interest from inventory, use a cash flow-based approach by adding the retention period of raw materials, work-in-progress, and products, subtracting the payment grace period for raw material accounts payable. This inventory cost is an off-balance liability. |
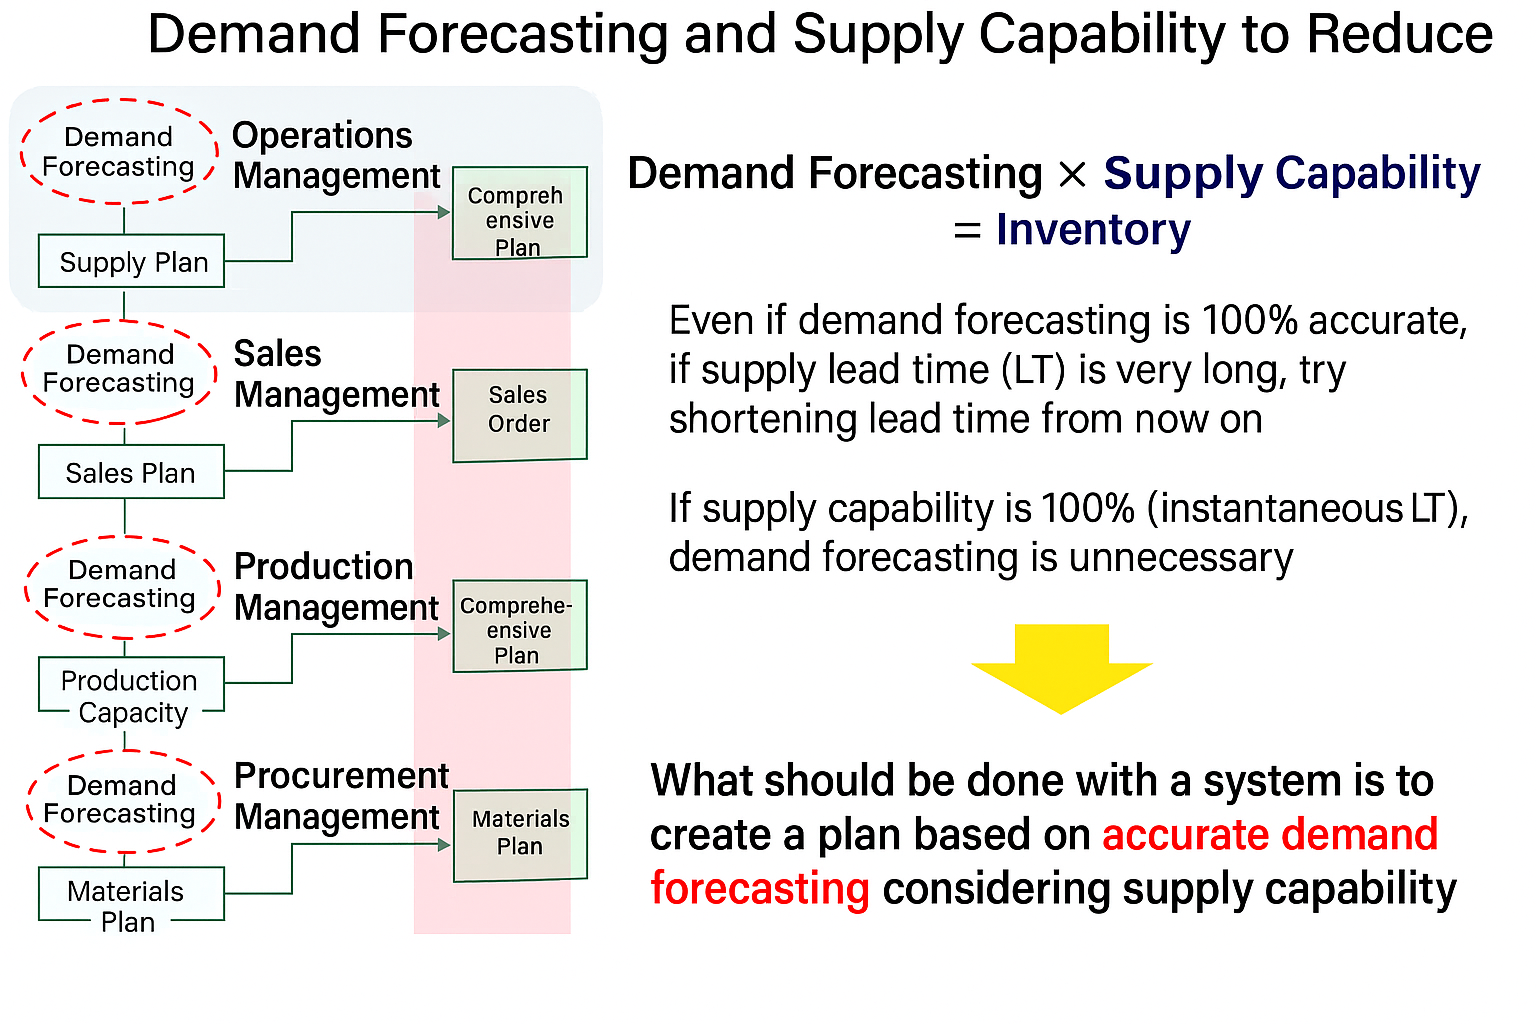 |
Inventory is not an issue if demand forecasting is 100% accurate with sufficient lead time or if there is supply capacity to respond instantly to demand. Inventory is determined by the accuracy of demand forecasting and supply capacity. The system creates plans based on accurate demand forecasts, considering supply capacity. |
System for Creating Total Optimized Plans
Now, let's explain the steps for systematizing 'visualization for total optimization.'
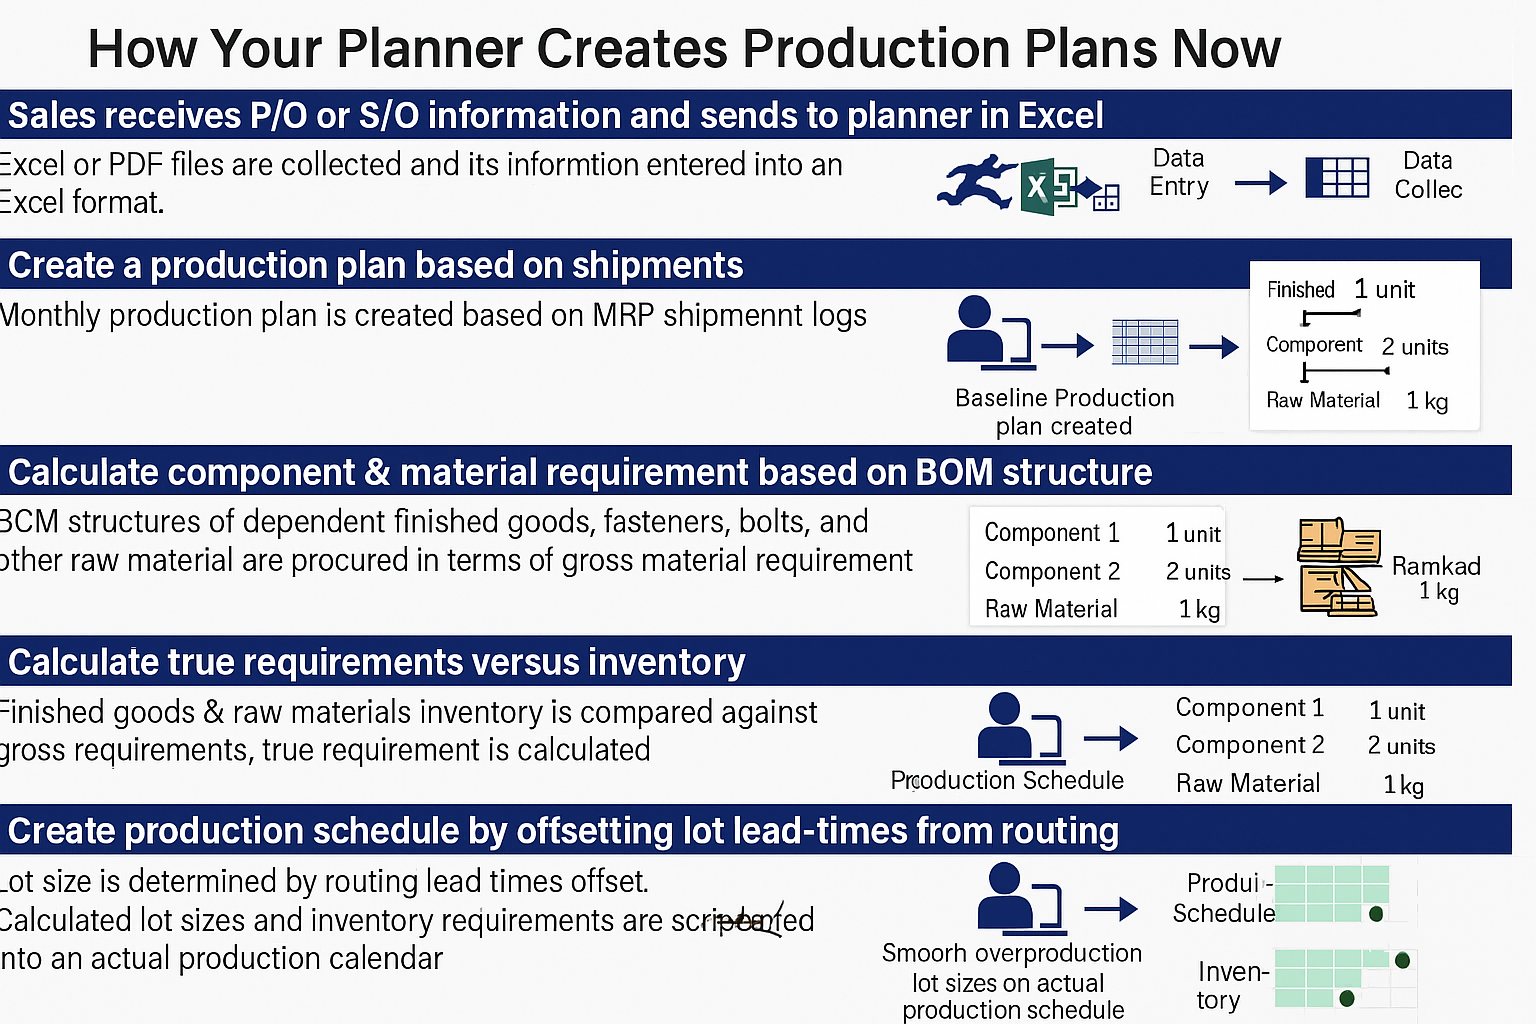 |
We will explain the system to maximize productivity, reduce price costs, shorten manufacturing lead times, and reduce inventory costs. Factory planners receive order and forecast information from sales, summarize it in Excel, and create production plans with shipping in mind. Based on the parts list, they calculate the number of parts and raw materials to be manufactured in the process, and calculate the net requirements after subtracting inventory. They create a production schedule that shifts lots by the number of manufacturing lead time days for each process and level the production quantity on days with overload. |
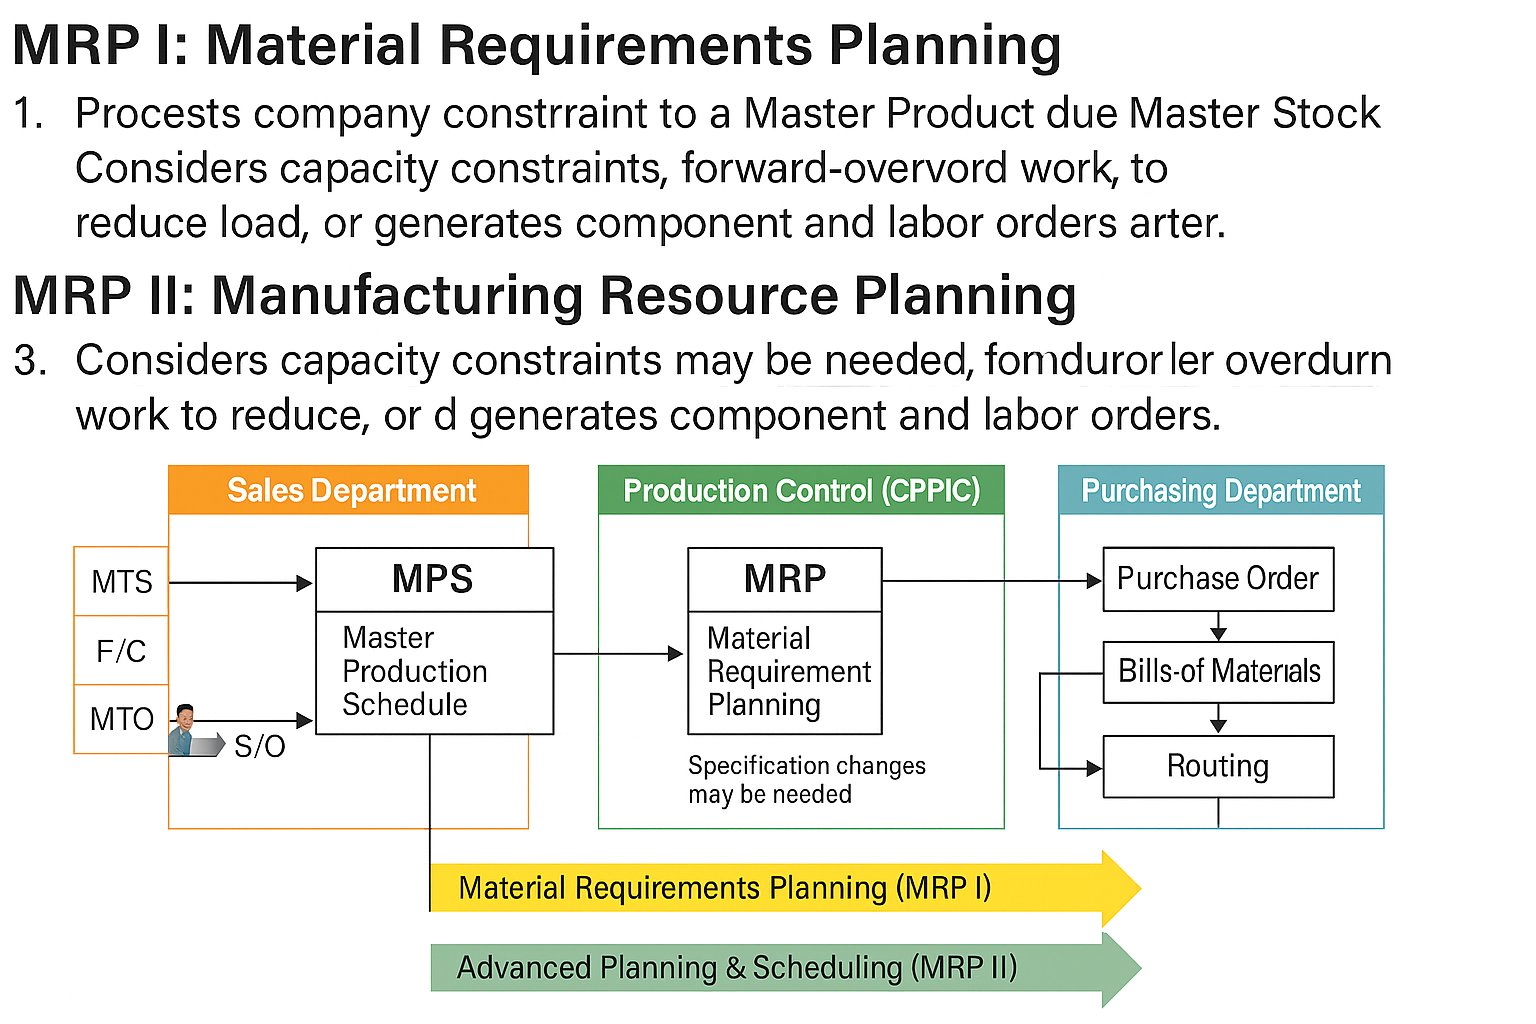 |
In general production management package systems, material requirements planning (MRP) is performed based on order information to develop requirements, create manufacturing orders for each process, and calculate raw material order quantities. In this case, equipment capacity for each process is not considered, so it is necessary to allocate the excess capacity to available days. When the number of products and equipment increases, manual work becomes difficult. Manufacturing Resource Planning (MRPII) considers equipment capacity for processes, automatically allocates overload work to available days or other equipment, and generates purchase orders. |
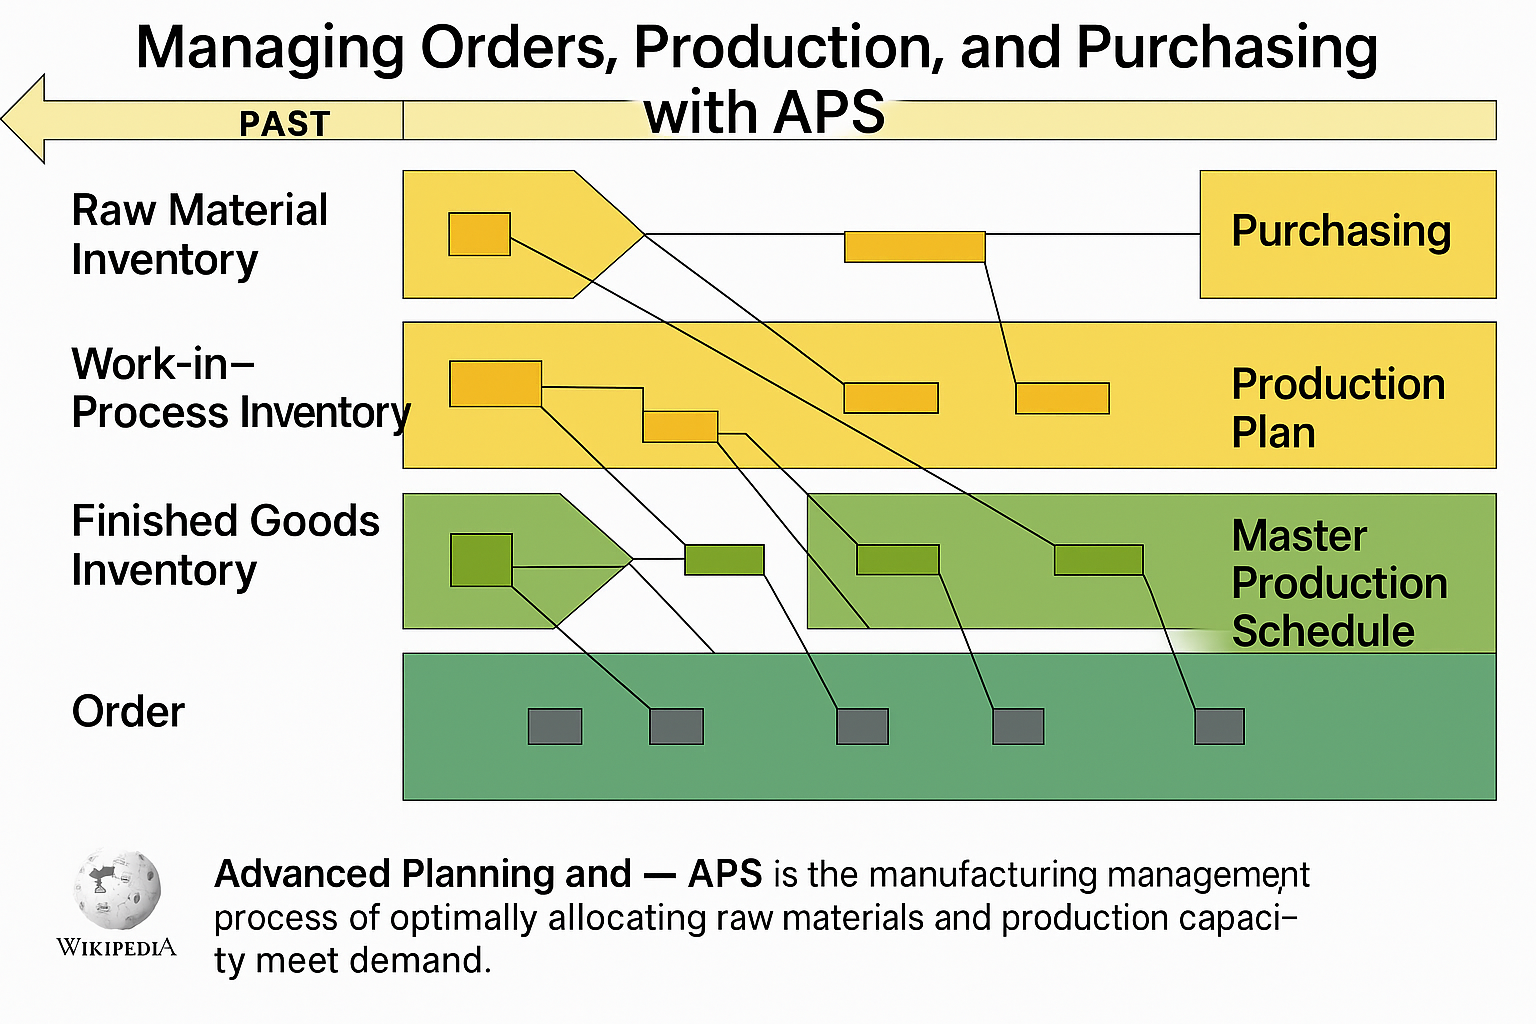 |
This is Manufacturing Resource Planning (MRPII), where orders, production, and purchasing are managed seamlessly. Productivity per unit time is improved by shortening lead times, and inventory costs are reduced by inventory reduction. The function to automatically generate production plans while achieving total optimization is called APS. In Japanese, it is "Advanced Planning and Scheduling," and APS visualizes the production schedule optimized for total optimization within the process connections. |
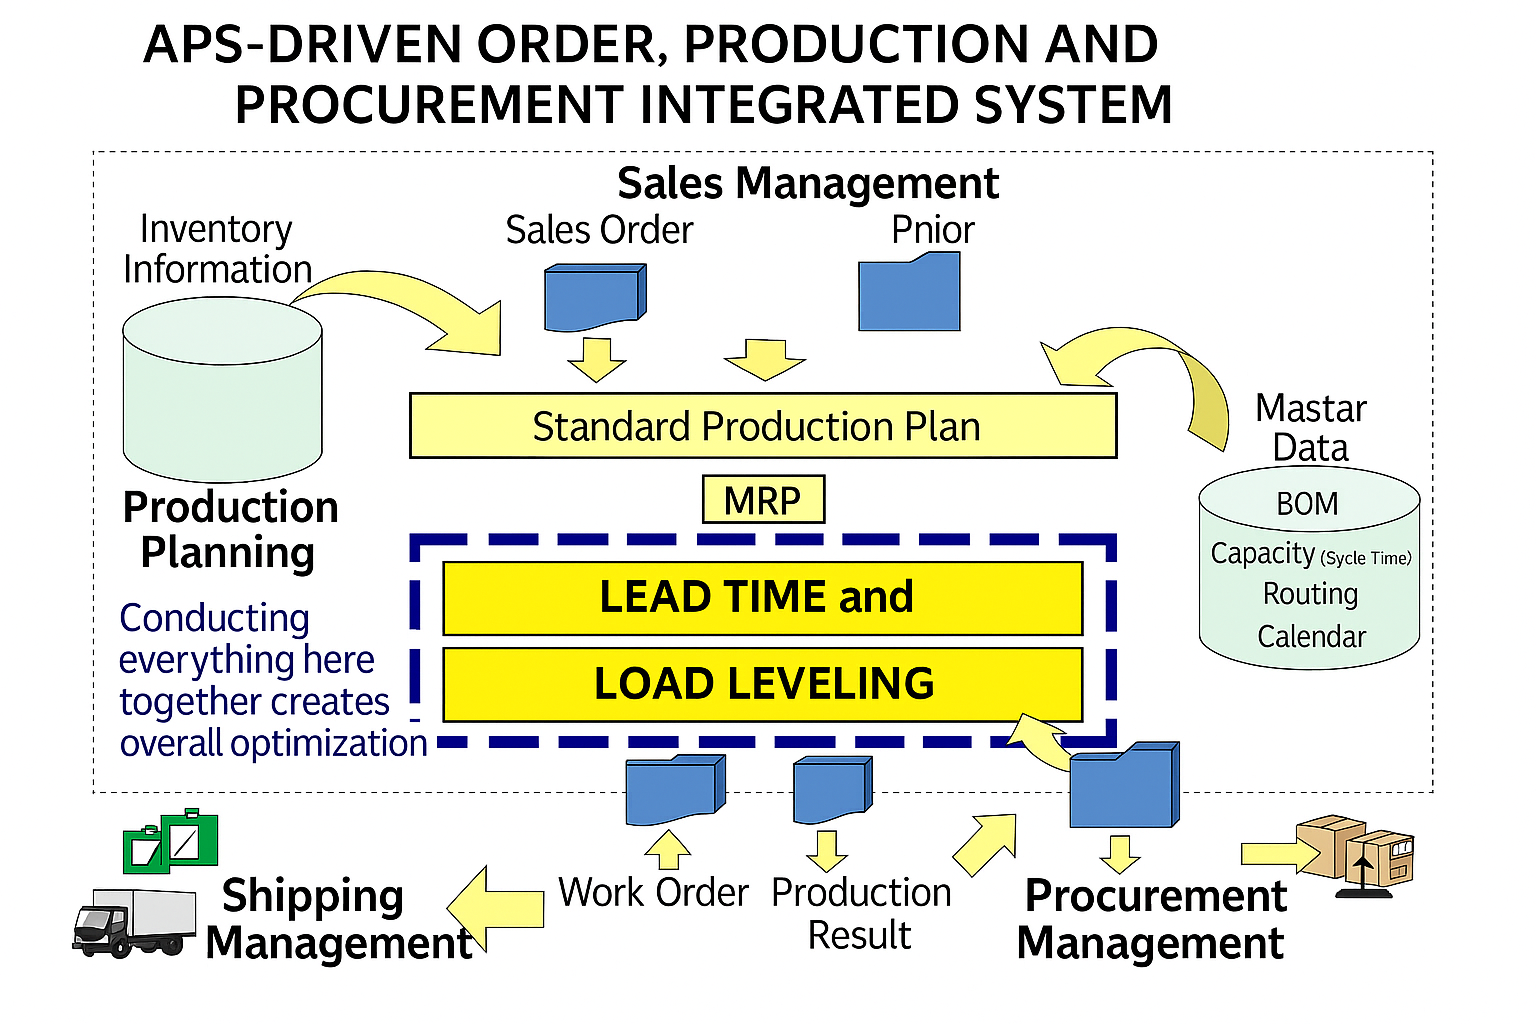 |
The system movement managed seamlessly from orders to production and purchasing with APS involves importing order information, developing requirements based on net product requirements after subtracting product inventory. Simultaneously, it levels the load without exceeding equipment capacity, allocates manufacturing orders to equipment, and issues purchase orders in time for the manufacturing start date. APS performs this series of operations all at once. |
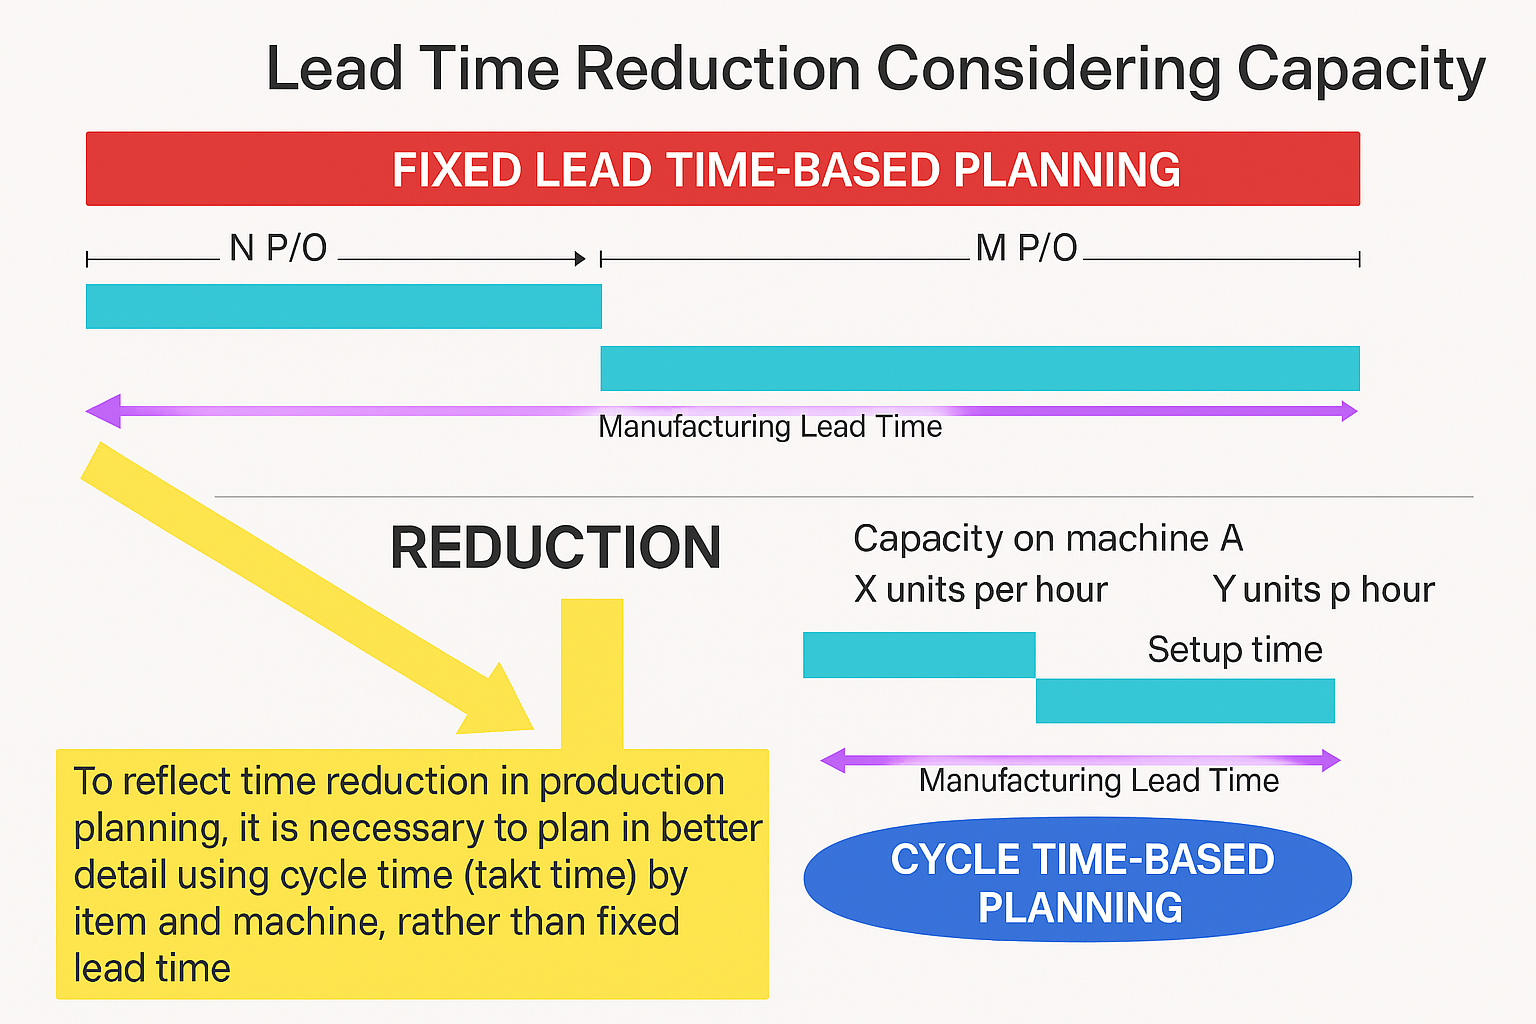 |
In APS, instead of fixed lead times like in production management systems, cycle times are set against equipment capacity. This creates a production plan based on cycle time considering machine capacity, resulting in shortened manufacturing lead times. In this case, setup times for mold changes and tank cleaning can be set, and plans can be made to reduce setup changes by continuously manufacturing the same item. Shortening manufacturing lead times increases productivity per unit time and reduces product costs. |
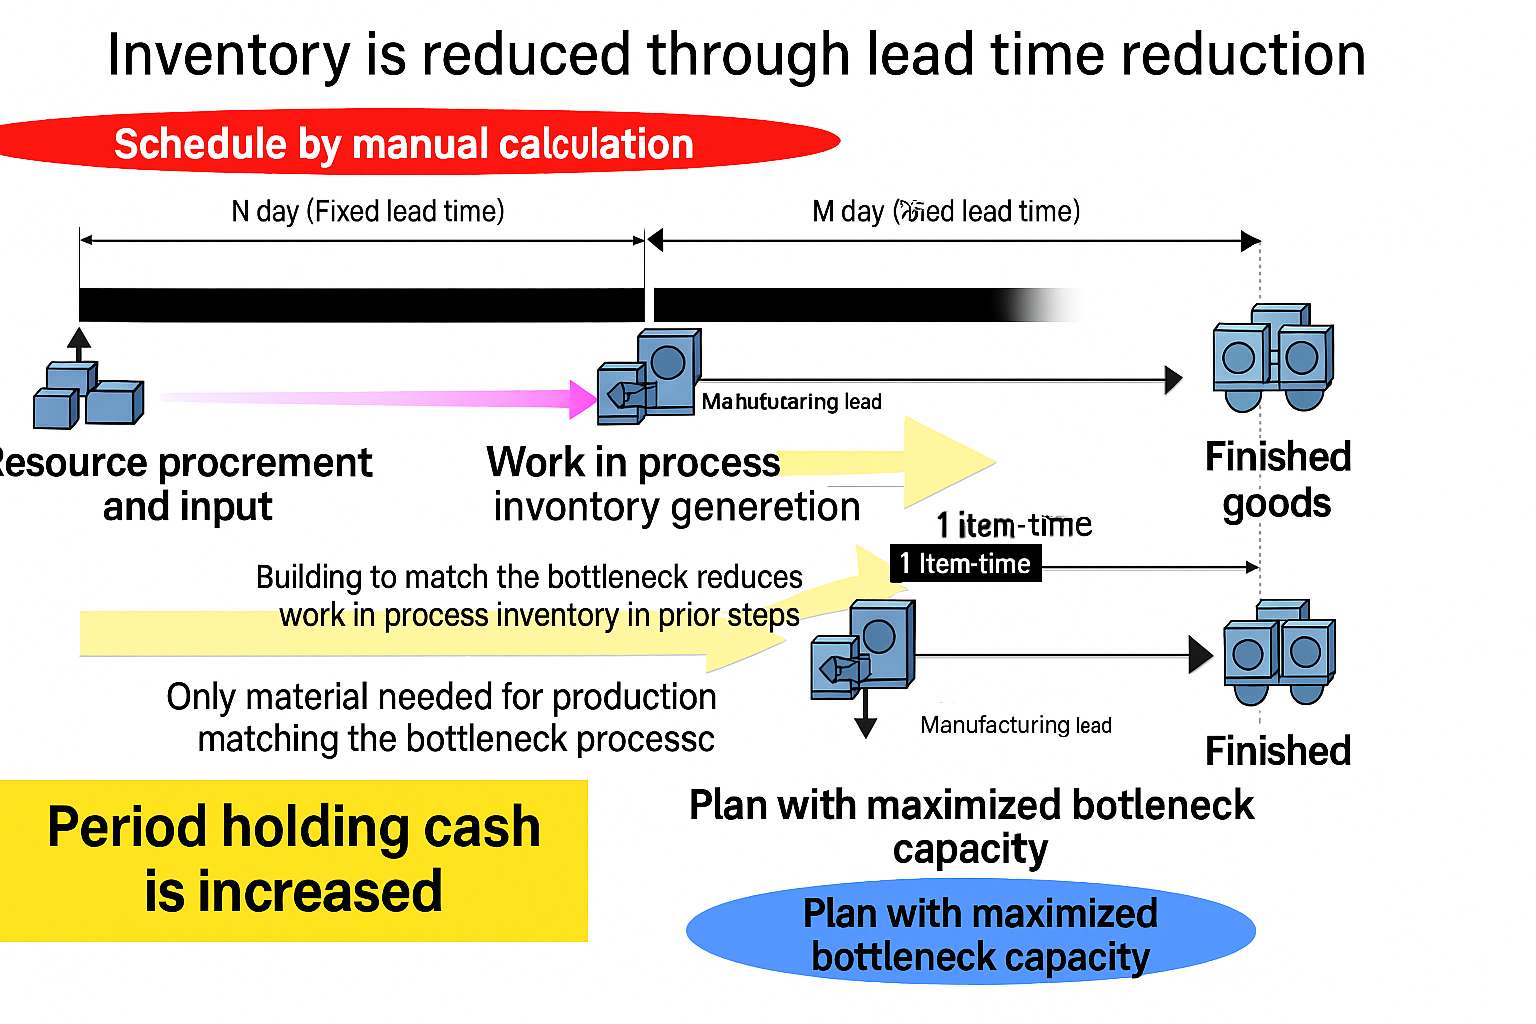 |
Shortening manufacturing lead times reduces inventory stagnation within processes, reducing inventory costs. As a result, the period during which cash can be held is extended, improving the company's cash flow. |
Functions of the Production Scheduler
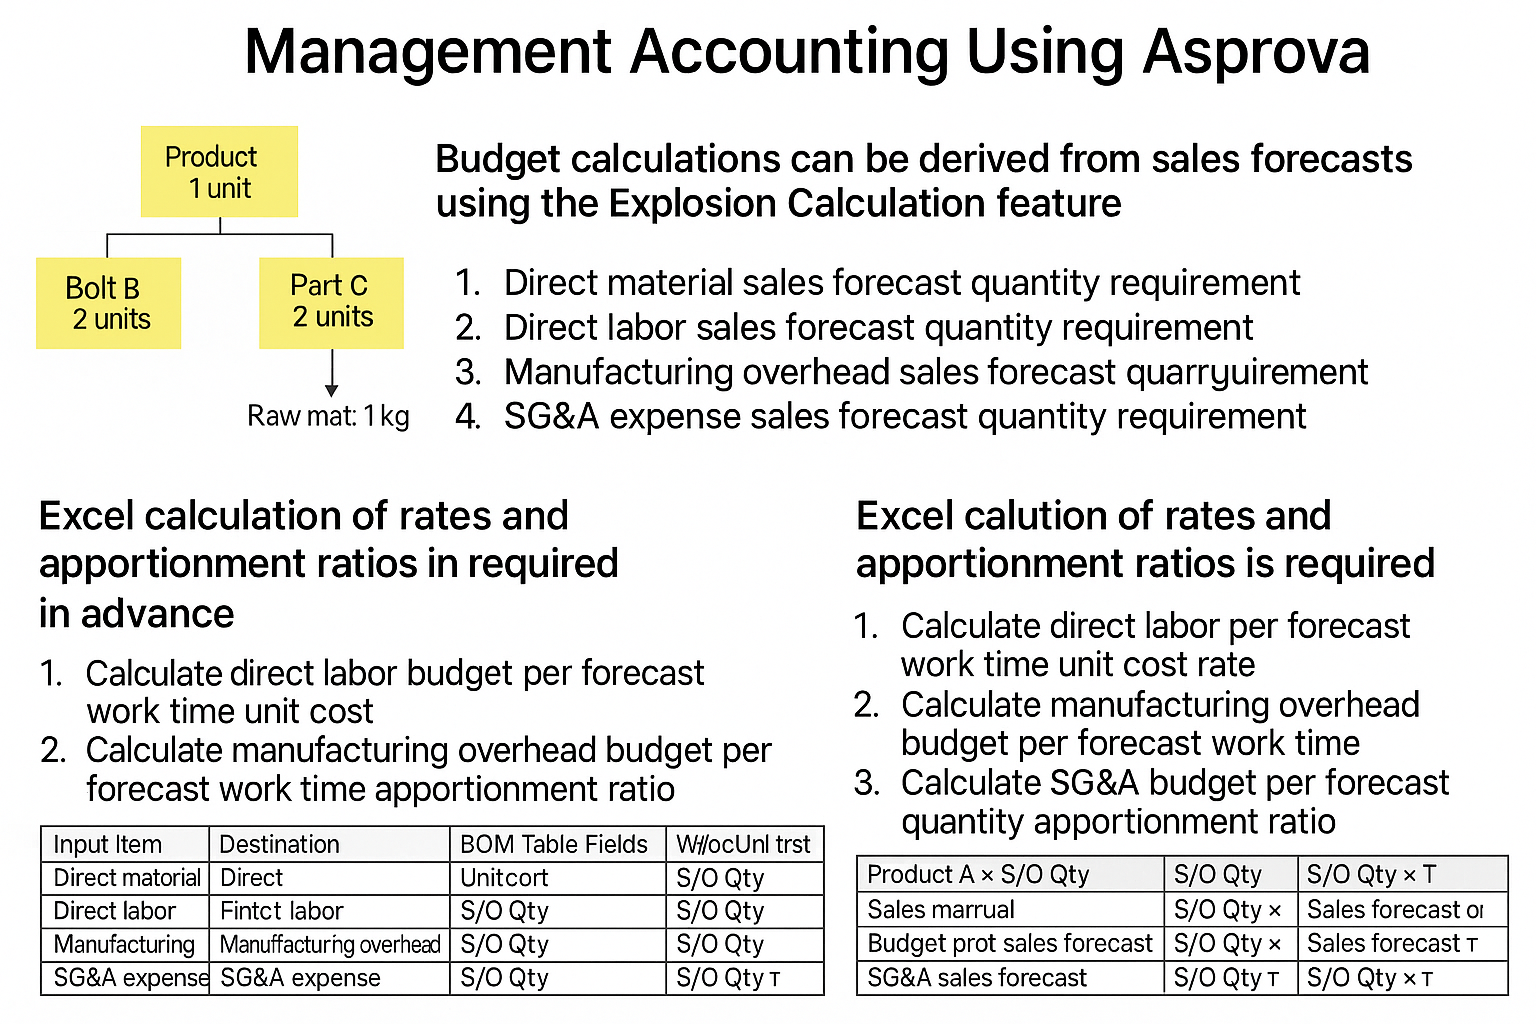
Introducing the functions of the production scheduler Asprova. Asprova allows for deployment calculations, and by setting standard material unit prices, labor cost rates, and manufacturing overhead allocation rates in the item master, it can calculate cost budgets and sales budgets for the next season based on planned production quantities.
 |
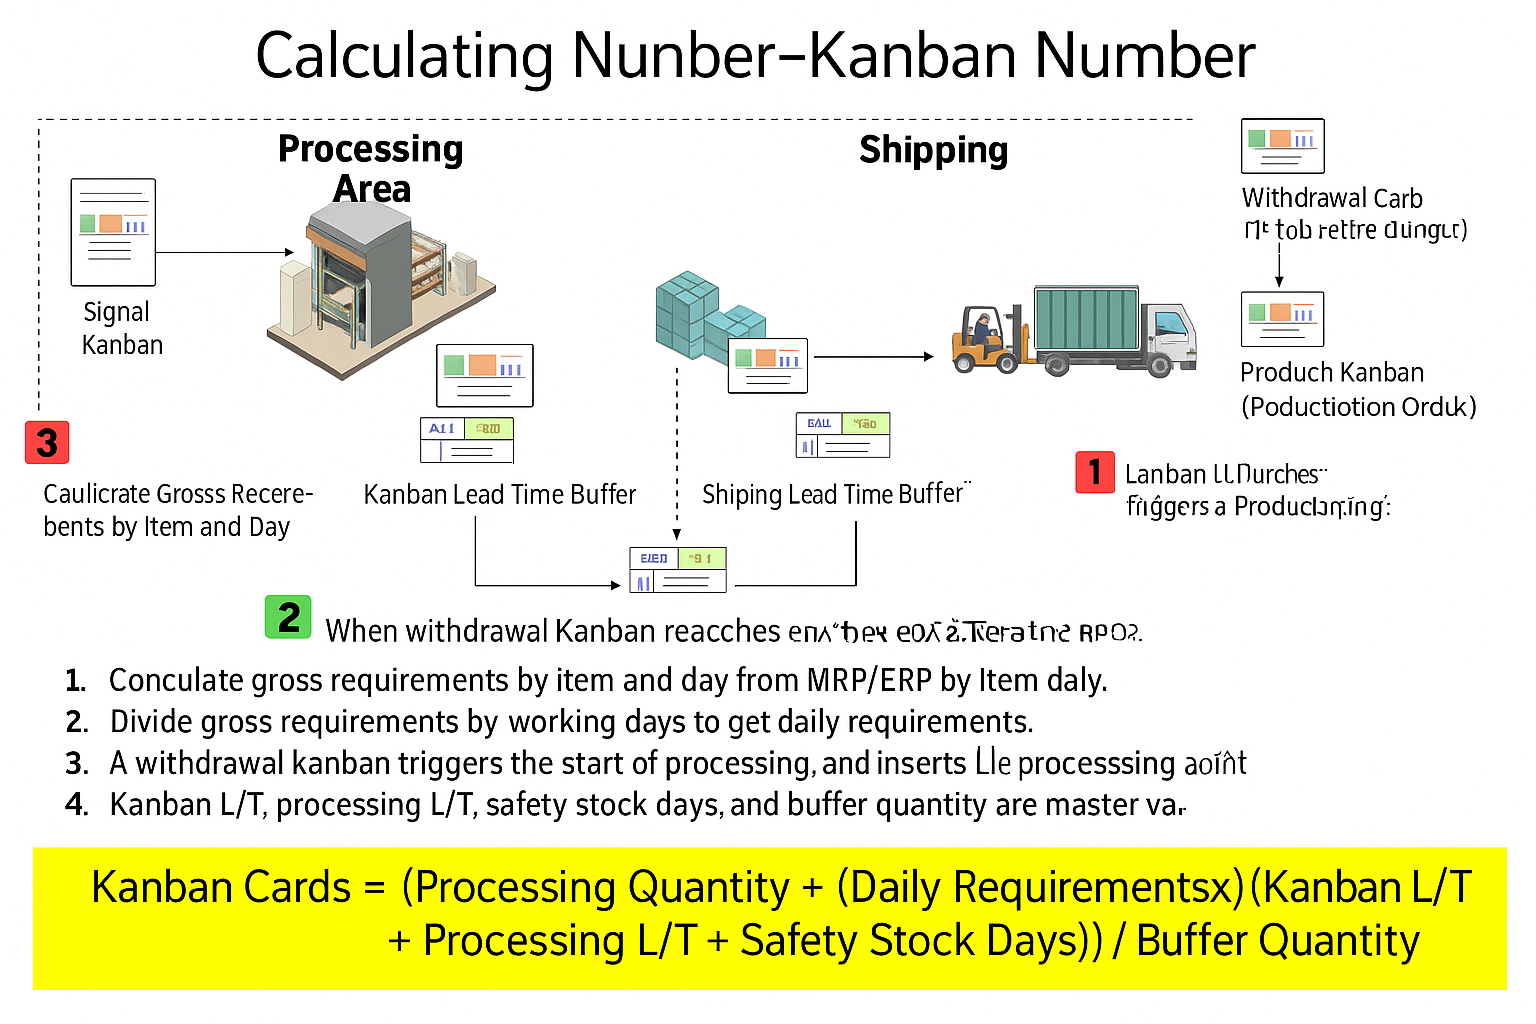
When delivering parts to TIMMIN or ADM in Indonesia, the production line may flow with kanban. Calculating requirements with MRP based on forecasts is the same concept as calculating the number of kanban cards based on forecasts. Using Asprova, it is possible to update the number of kanban cards monthly and adjust the flow of kanban on the shop floor. |
 |
Our company adopts a policy of gradually improving and integrating systems into the shop floor, similar to Excel, without taking a grand stance on system implementation. Basically, it is possible to implement according to the customer's budget.
Frequently Asked Questions | Total Optimization in Manufacturing
We will briefly organize the recurring questions in line with the content of this article.
What challenges do Japanese manufacturers in Indonesia face?
Japanese manufacturers in Indonesia are required to respond to shortened product lifespans and diversified small-lot production. This can increase waiting times between processes and worsen on-time delivery rates. Additionally, supply chain fluctuations often lead to excessive inventory purchasing plans.
What does total optimization refer to?
Total optimization refers to maximizing production efficiency, reducing unit time costs, and minimizing inventory costs to maximize profits. It is important to create seamless plans between departments and shorten internal stagnation time to reduce inventory costs.
What are the functions of the production scheduler Asprova?
Asprova allows for deployment calculations and can calculate cost and sales budgets based on planned production quantities by setting standard material unit prices and labor cost rates. It also supports kanban-based production line management.