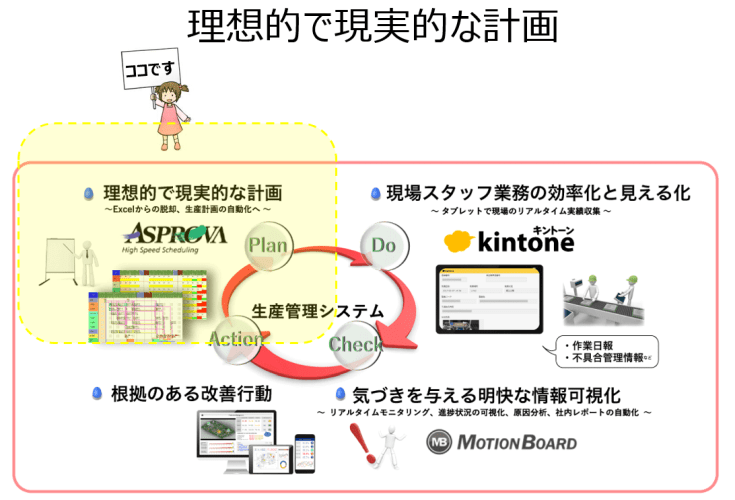
Today, I’ll be handling the initial "Plan" part of the PDCA cycle, which involves creating a production plan with a system, recording manufacturing performance on a tablet, and visualizing scheduled versus actual data using a BI tool.
My section primarily relates to manufacturing companies, but the subsequent explanations about Cybozu Kintone and WingArc Motion Board are not limited to manufacturing and can be applied to business operations in general, I believe.
This time, there will be no handouts distributed, but if you need the materials, please check the "Request Materials" option in the survey, and we’ll send them to you via email later.
-

-
Production Control System in Indonesia
It’s not limited to Indonesia, but it’s often said that the ultimate goals of the manufacturing industry are twofold: "cost reduction through productivity improvement" and "delivering products on time without delays." From a management perspective, business plans are crafted to maximize growth based on market supply and demand adjustments. However, even if sales increase due to low pricing, it only reduces gross profit, leading to losses from selling and administrative expenses or non-operating costs. On the other hand, raising unit prices isn’t straightforward due to market price considerations. Therefore, process management based on production plans aimed at reducing costs through ...
続きを見る
Company Introduction
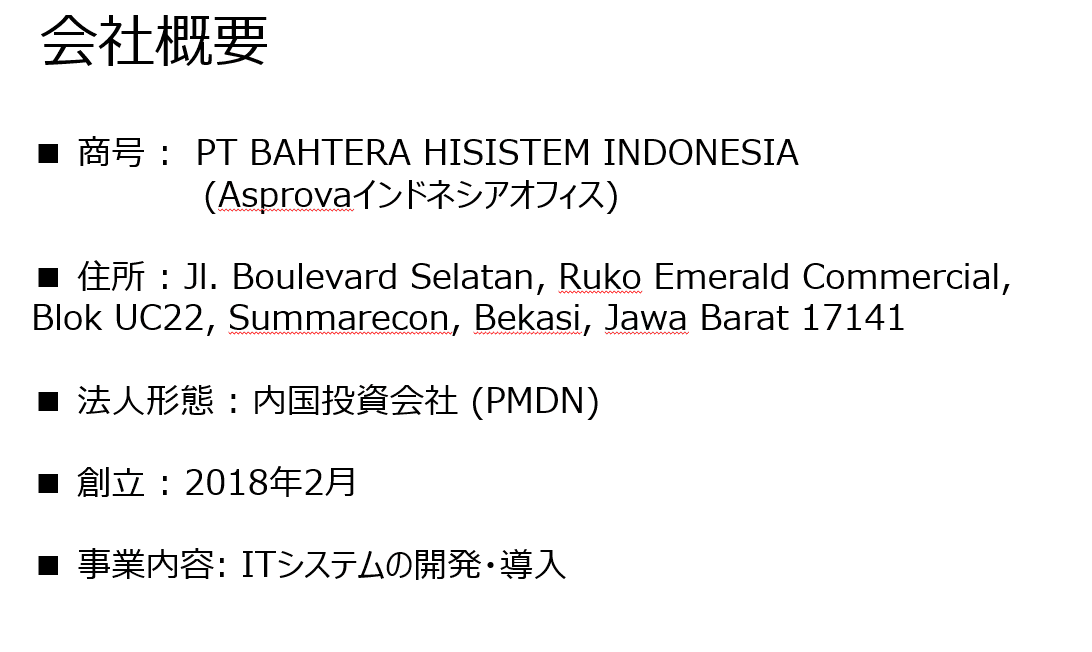 |
Let me briefly introduce our company. We are Bahtera High System, with an office in Summarecon, West Bekasi.
We were established just last year, but I personally have been working in the systems field for about 20 years. |
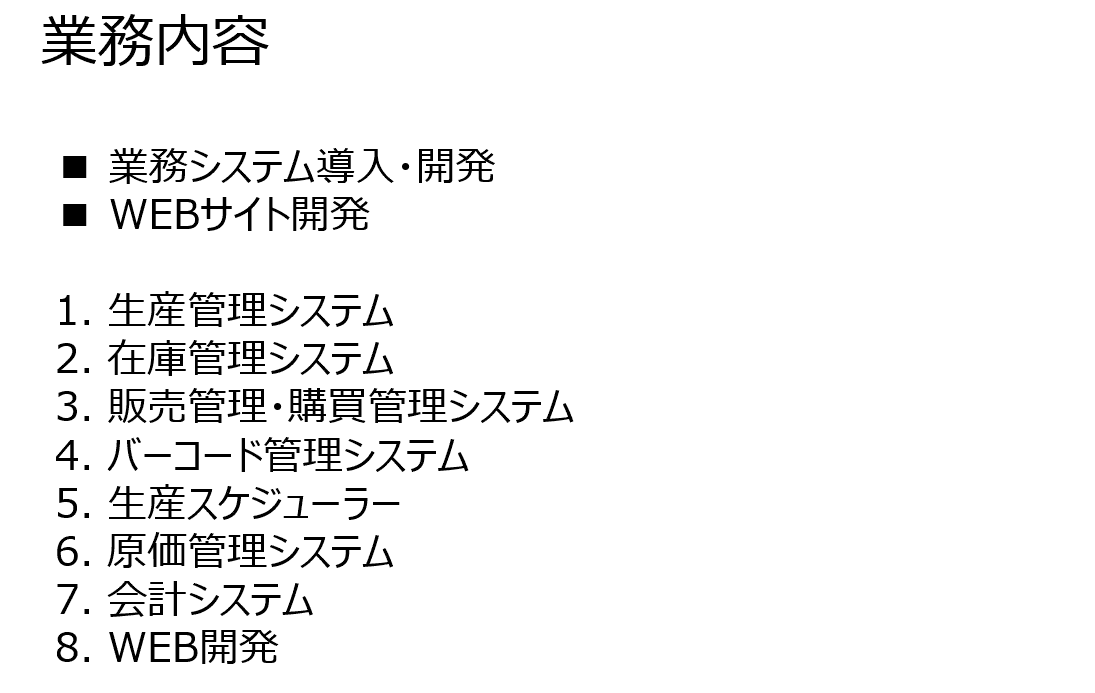 |
Our business focuses mainly on manufacturing systems in general, including systemization of production management, inventory management, sales and procurement, production planning, cost accounting, and financial accounting. |
Challenges Facing Japanese Manufacturing Companies in Indonesia in Recent Years
Now, let’s dive into the main topic. First, I’d like to take a look at the tough environment surrounding Japanese manufacturing companies in Indonesia, where "visualization for overall optimization" is said to be necessary.
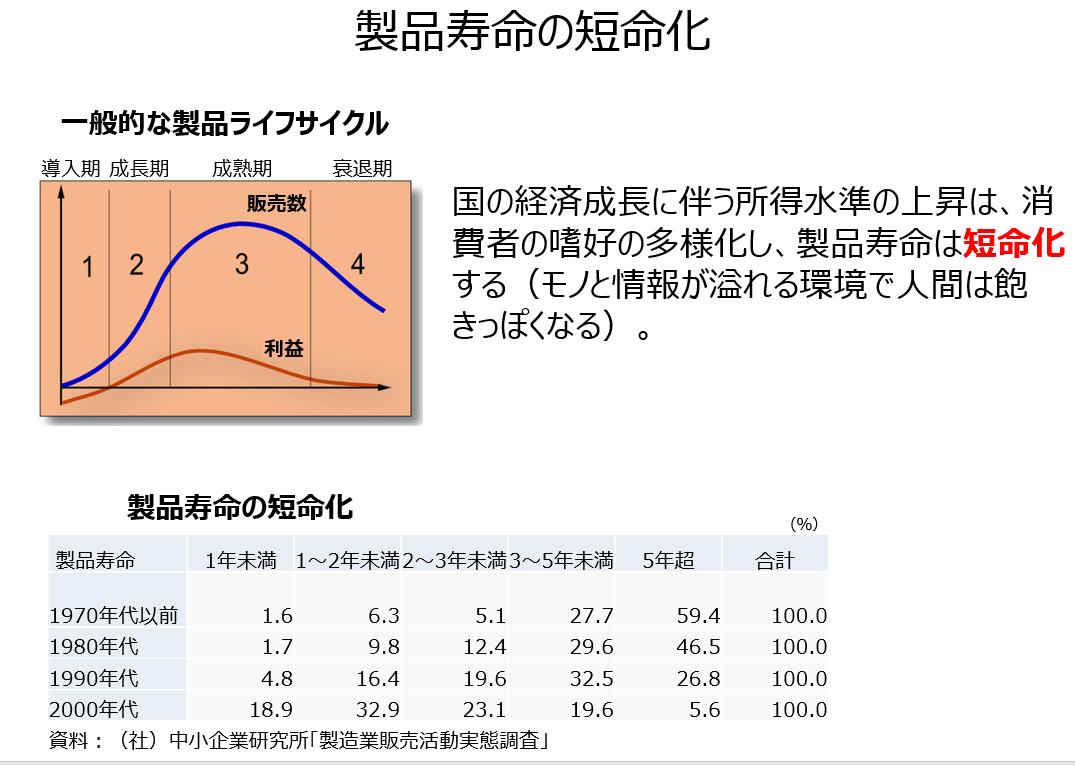 |
The shortening of product lifespans is, I think, an inevitable phenomenon as Indonesia’s economy grows and consumer income levels rise, leading to increased consumption desire, diversified preferences, and quicker boredom.
Recently, with rising salaries in Indonesia, I often see Indonesian families at shopping mall restaurants ordering a table full of delicious-looking food, and it makes me feel, "Wow, everyone has money these days."
From a macroeconomic perspective, Indonesia’s economy is often described as experiencing "moderate growth." This is largely because low domestic processing technology limits value-added exports, resulting in persistent trade deficits.
Essentially, it’s an outflow of domestic assets, but the growing consumer population more than compensates, driving this moderate growth. |
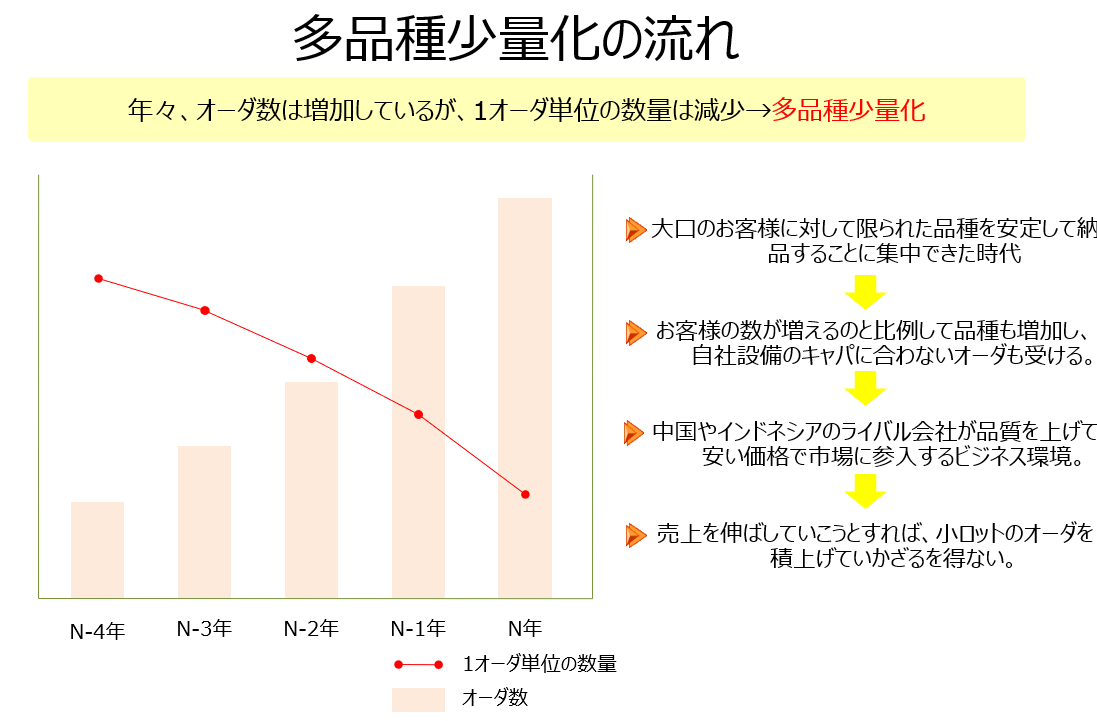 |
The shortening of product lifespans demands high-mix, low-volume production from manufacturers on the supply side.
About 10 years ago, many factories focused on delivering large-lot products to major clients on time without delays.
However, recently, the proportion of sales from large clients has decreased, making it difficult to maintain performance without stacking up small-lot orders.
This is likely influenced by companies increasing local procurement rates and facing fiercer competition from rival firms in China, Indonesia, and other countries. |
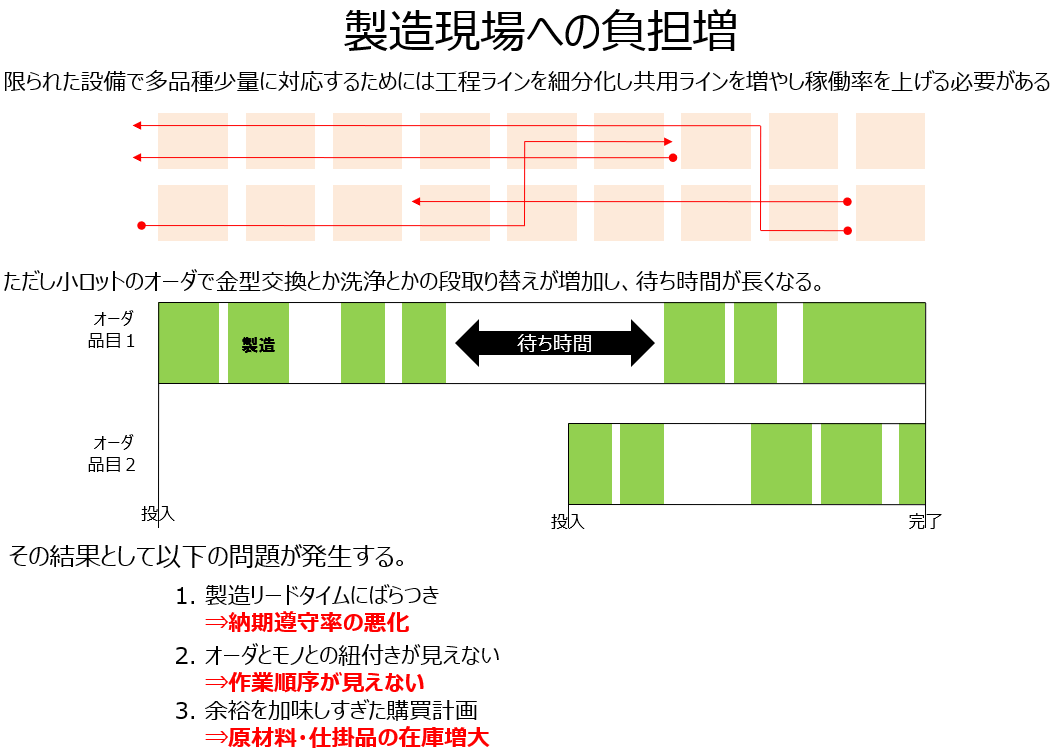 |
To handle high-mix, low-volume production, it’s necessary to subdivide process lines and increase shared lines to boost the utilization rate of limited production equipment.
However, the smaller the lot size, the more frequent setup changes like mold swaps or cleaning become, and waiting times between processes tend to increase depending on item type, quantity, and line congestion.
As a result, production lead times per product vary, on-time delivery rates worsen, process dependencies become harder to see, task sequences become unclear, and procurement plans often overstock to avoid line stoppages due to material or resource shortages. |
 |
Naturally, as the number of customers grows, various demands arise—some clients request unreasonable order changes, while some suppliers fail to meet deadlines.
In the supply chain, the raw material supply side is called upstream, and the side closer to the final consumer is downstream. Demand fluctuations downstream ripple upstream, while supply fluctuations upstream ripple downstream with a cascading effect.
This phenomenon, where the effect amplifies the further it travels, is likened to the flick of a whip and called the bullwhip effect. |
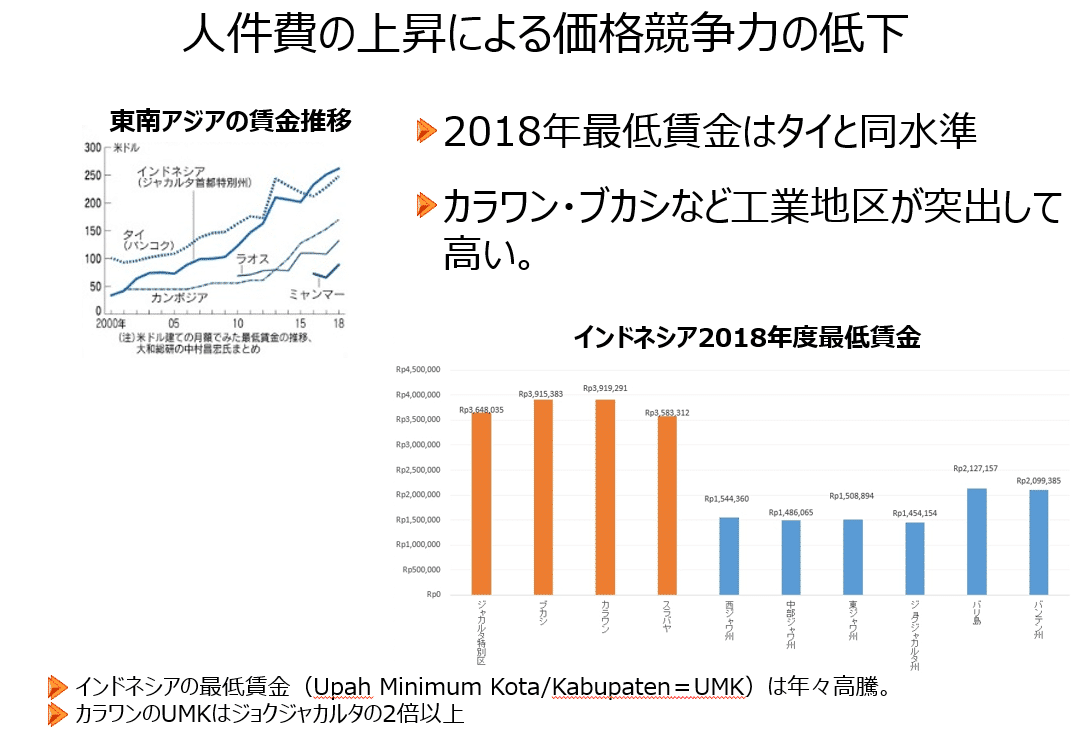 |
Since the Jokowi administration took office in 2014, excessive consideration for labor unions has driven up labor costs. Recently, with inflation stabilizing below 5%, protests demanding minimum wage (UMP) increases seem to have subsided.
Even so, the minimum wage here in Bekasi Regency is among the highest in Indonesia, nearly double that of Central Java. |
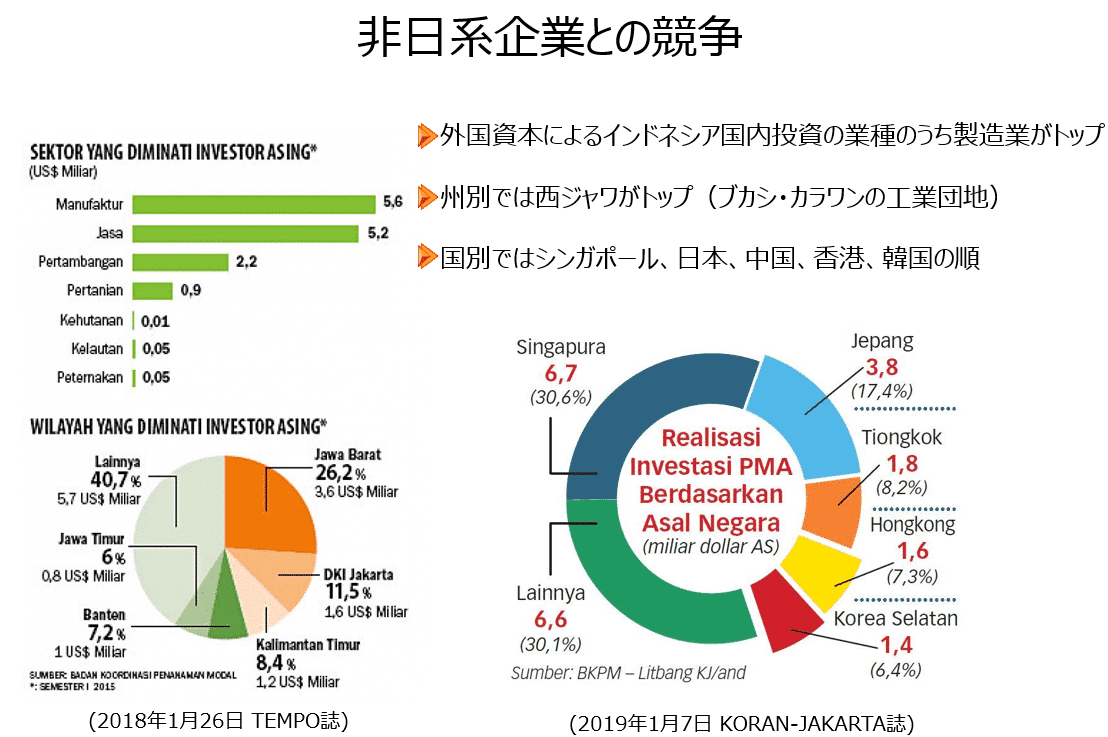 |
It’s said that Japanese-related companies in Indonesia employ over 7 million people, with investment amounts ranking second only to Singapore by country.
Under the Suharto regime, manufacturing contributed over 20% to GDP, but it has now fallen to 16%. The second Jokowi administration, starting this year, aims to raise this to 25% by promoting downstream industries that add value to raw materials. |
Shifting from Partial to Overall Optimization for Productivity Improvement
So, how should Japanese manufacturing companies respond to these harsh realities? Here, I’d like to consider responses from the perspective of shifting from partial to overall optimization to improve productivity.
 |
The definition of overall optimization is that, as a result of maximized production efficiency, per-unit price costs decrease, inventory costs are minimized by reducing stock, and profits are maximized.
Here, we exclude factors like market price fluctuations or price negotiations that cannot be controlled by the system. |
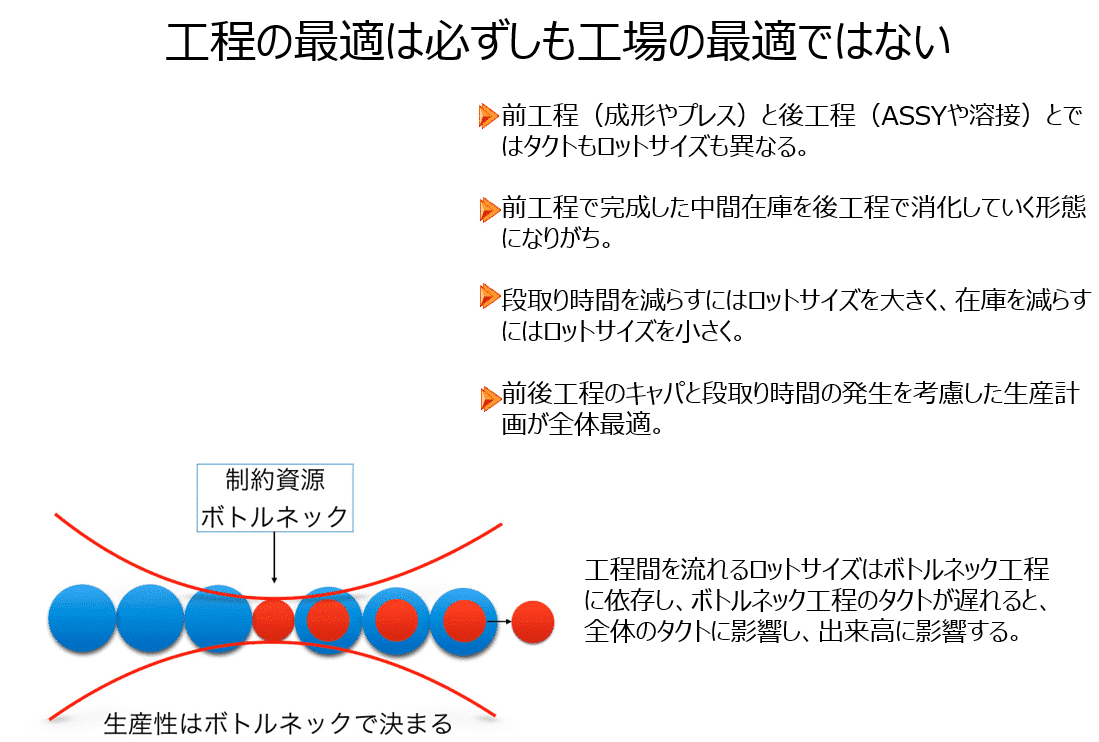 |
In Indonesia, the front-end process is often molding or pressing, while the back-end is assembly or welding. Since takt times differ between front- and back-end processes, production typically involves the front-end creating intermediate inventory that the back-end consumes.
A factory’s overall production capacity cannot exceed the bottleneck process’s capacity. Rather than producing excessively just because capacity is high, aligning takt times between front- and back-end processes prevents inventory buildup and waiting times, reducing stranded inventory and inventory costs. |
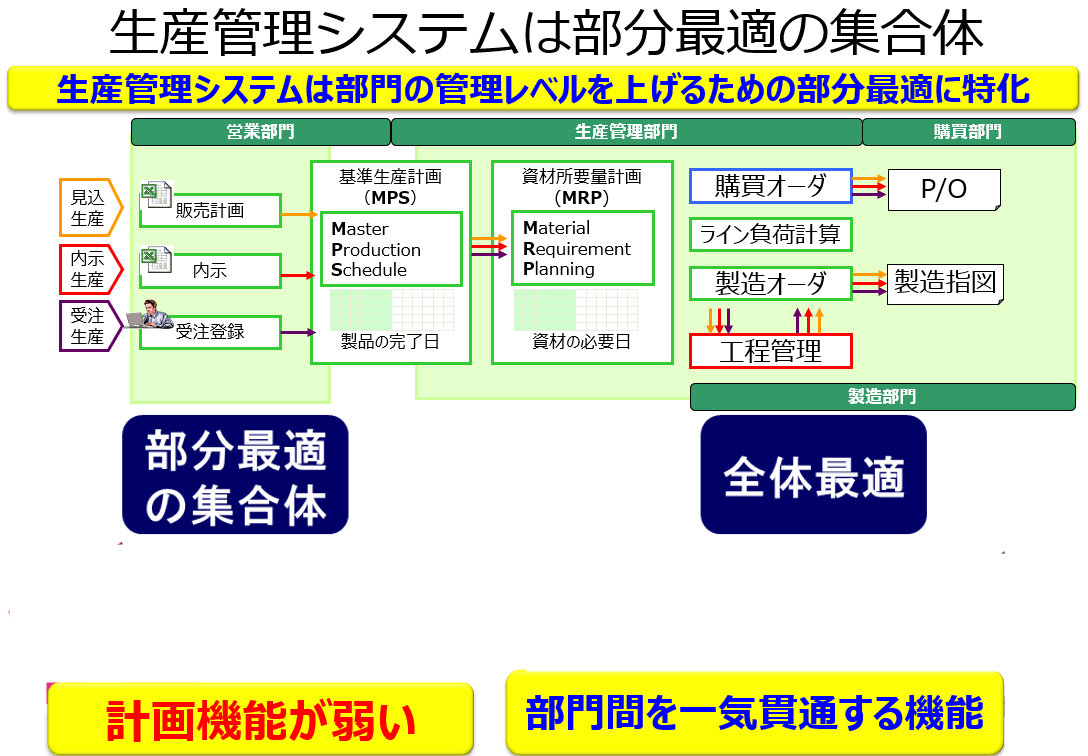 |
Typical production management systems are designed with departmental optimization in mind to enhance management at the departmental level.
It’s natural that production management systems, being a collection of partial optimizations, are weak in planning functions needed for overall optimization.
For overall optimization, a function to create seamless, end-to-end plans across departments is essential. |
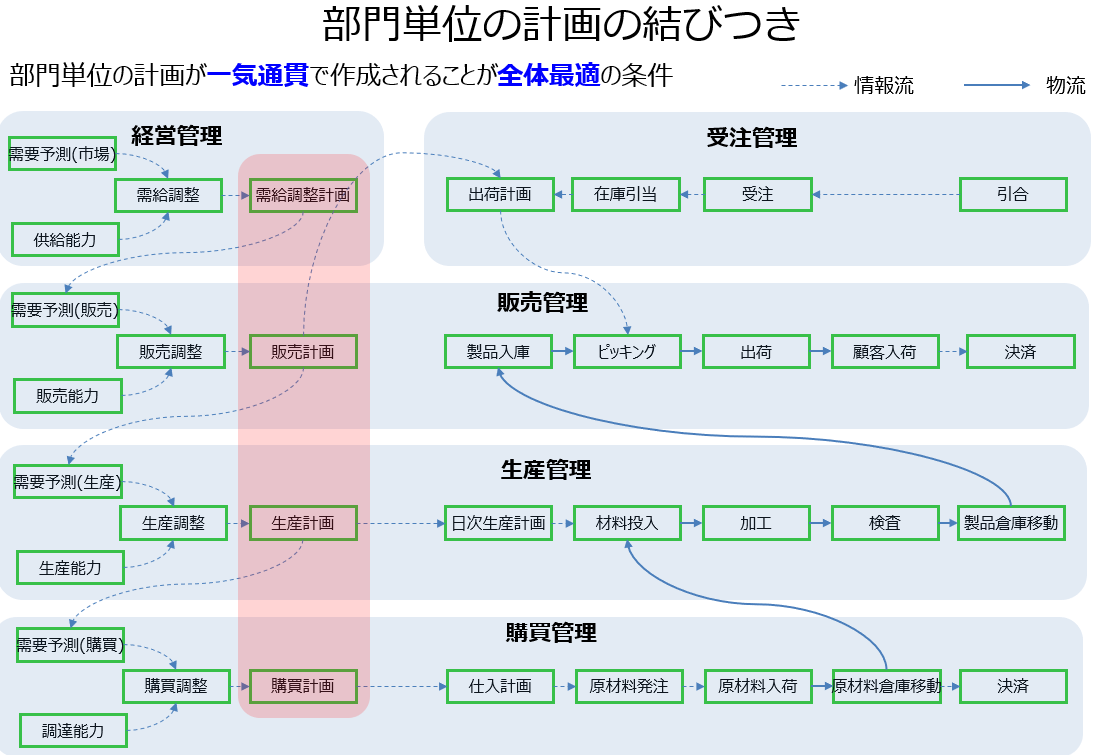 |
Within a company, departments like sales, production, and procurement operate under management, with plans created based on each department’s supply and demand.
What’s critical for overall optimization is that these departmental plans are created seamlessly from end to end. |
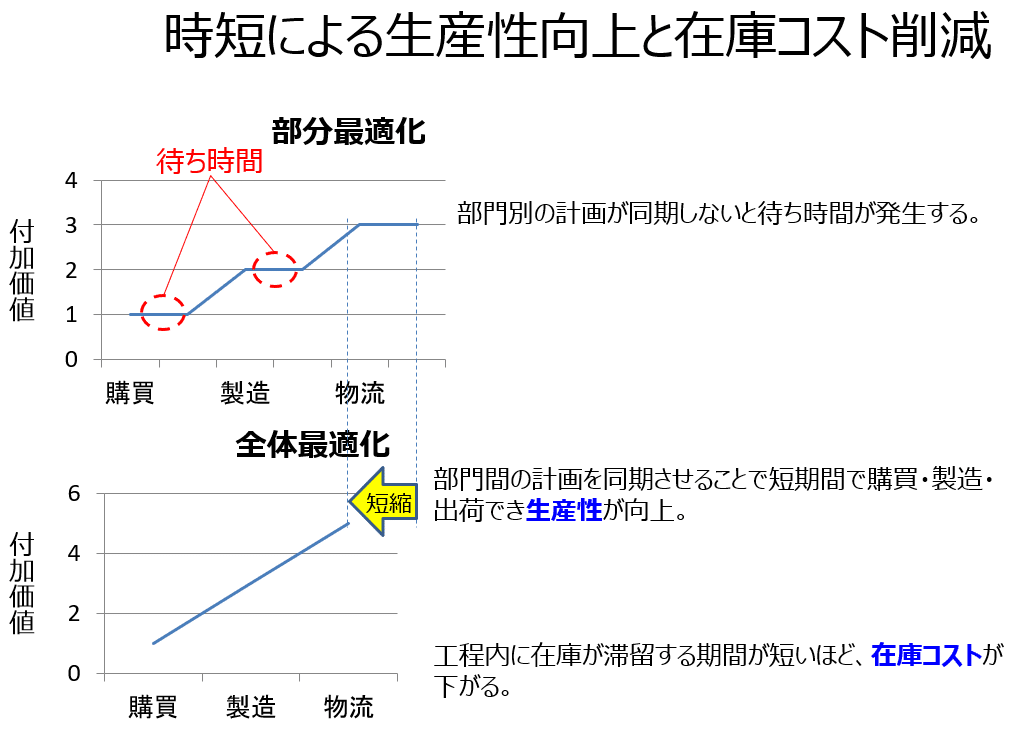 |
When lead times extend due to waiting times between departments, products linger in the warehouse, delaying their shipment and conversion into sales, which increases inventory costs.
If operations flow according to synchronized plans across departments, the time products remain in-house shortens, reducing inventory costs. |
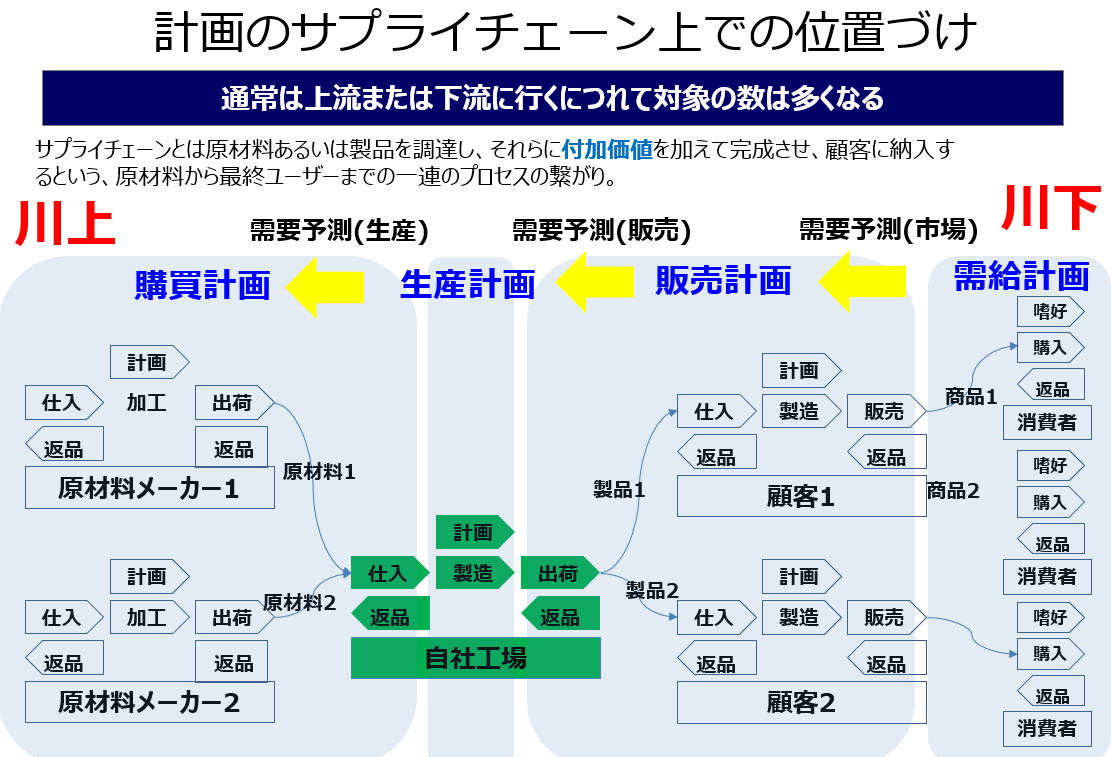 |
The plan I just mentioned is a supply chain plan centered on our factory, outlining how goods and information flow with added value from upstream raw material manufacturers to downstream final consumers for economic activity. |
Inventory Costs and Opportunity Loss Risks
For overall optimization, departmental plans need to be seamlessly established, reflecting the idea of reducing inventory costs and opportunity loss risks to achieve optimal inventory levels.
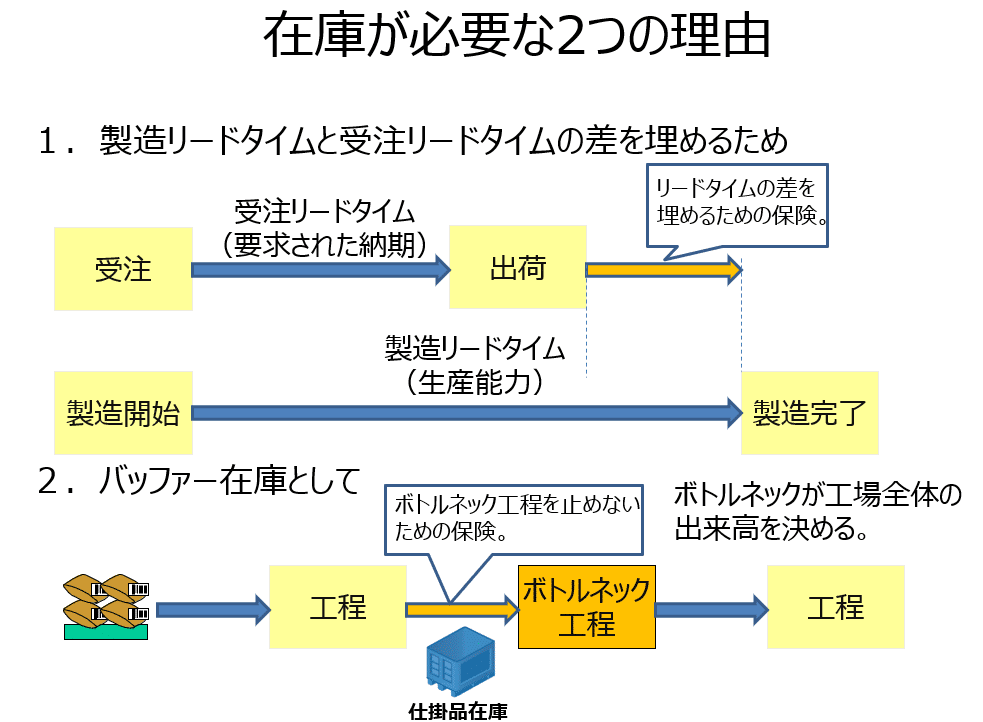 |
Inventory serves as insurance to bridge the gap between order lead time and manufacturing lead time—meaning, for a product that takes 10 days to manufacture, you can’t ship it in 5 days without inventory.
It also acts as a buffer to maximize the bottleneck process’s utilization rate—since a factory’s overall productivity is determined by the bottleneck, inventory ensures its maximization. |
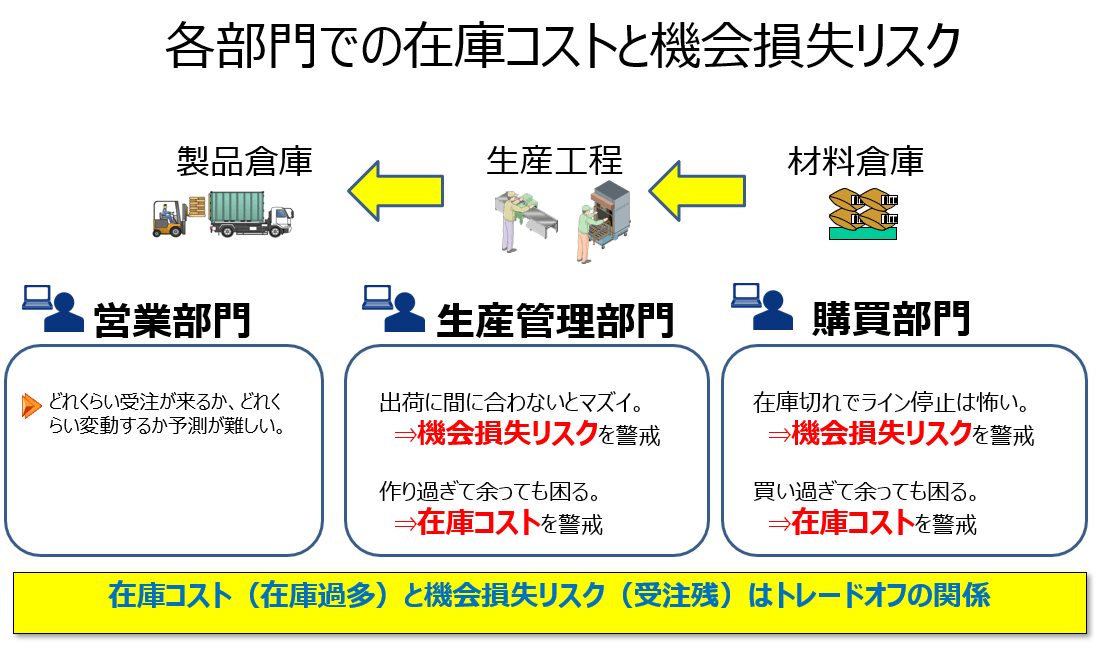 |
Each department’s staff operates with inventory costs and opportunity loss risks in mind.
There’s a trade-off relationship between inventory costs and opportunity loss risks—focusing on one often compromises the other. |
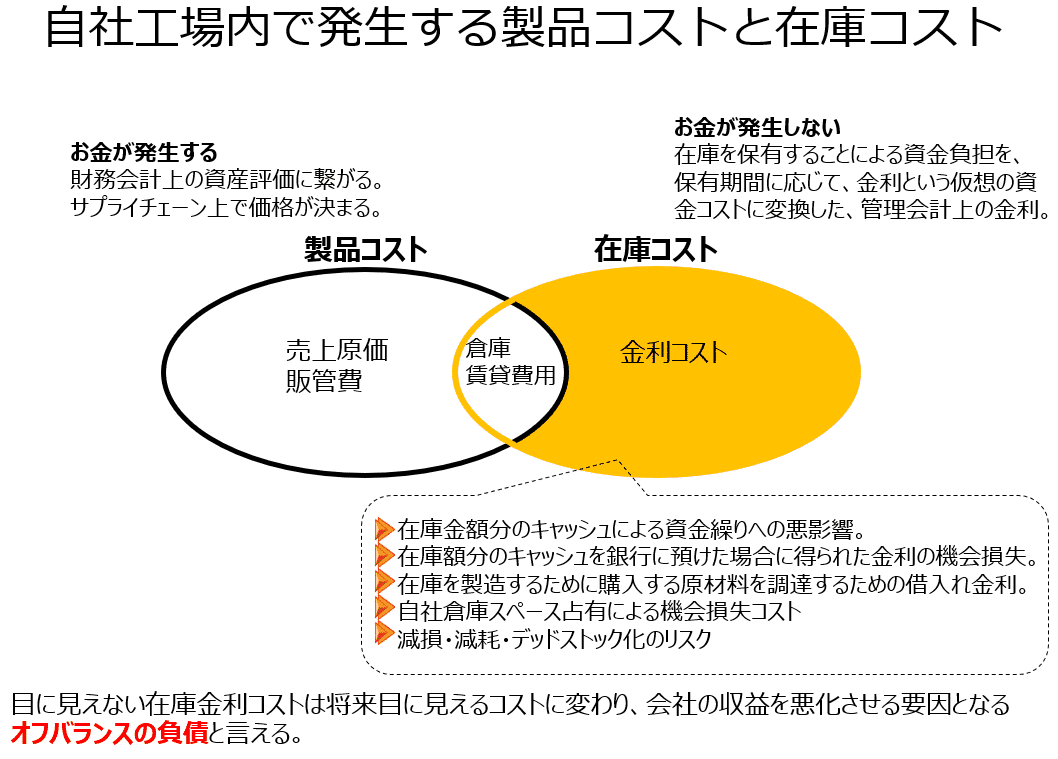 |
The cost of added value within the supply chain is recorded as product cost in accounting, but interest from inventory lingering in-house is an off-balance-sheet expense.
This represents the hypothetical value of what could have been done with that inventory as cash or the revenue it could have generated, also known as opportunity loss. |
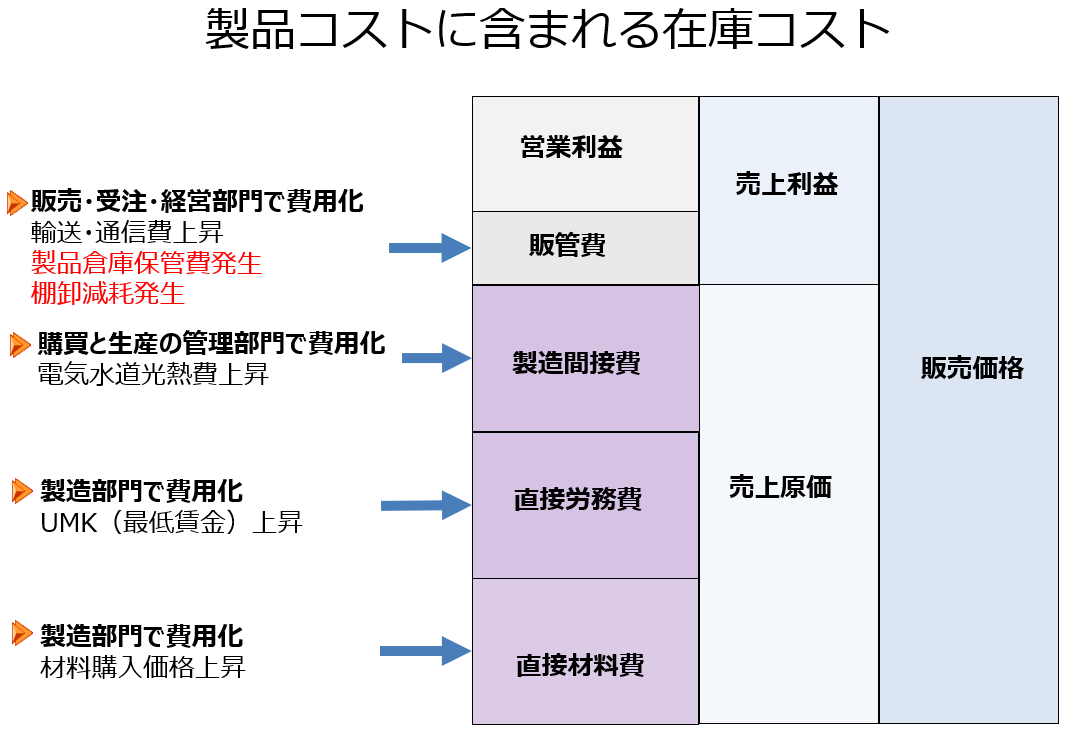 |
Product costs consist of the cost of goods sold—determined by the number of products shipped multiplied by their manufacturing cost (unit cost)—and selling, general, and administrative expenses incurred to sell them. Subtracting these from sales yields operating profit in accounting terms.
Items like inventory write-downs or warehouse rental fees, part of recorded SG&A expenses, are both product costs and interest incurred due to inventory. |
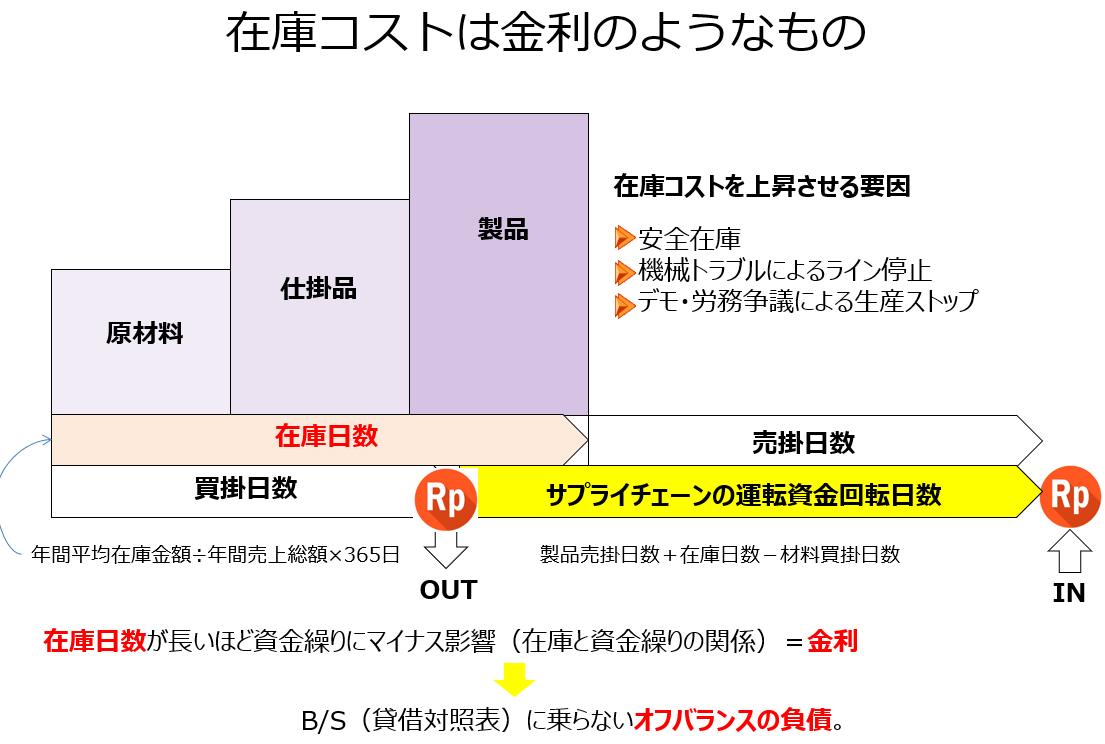 |
To estimate interest incurred due to inventory, you calculate the time raw materials, work-in-progress, and finished goods remain in-house, add the period until accounts receivable are collected, and subtract the payment deferral period for raw material accounts payable, using a cash flow-based approach.
This inventory cost is an off-balance-sheet liability not reflected in the balance sheet. |
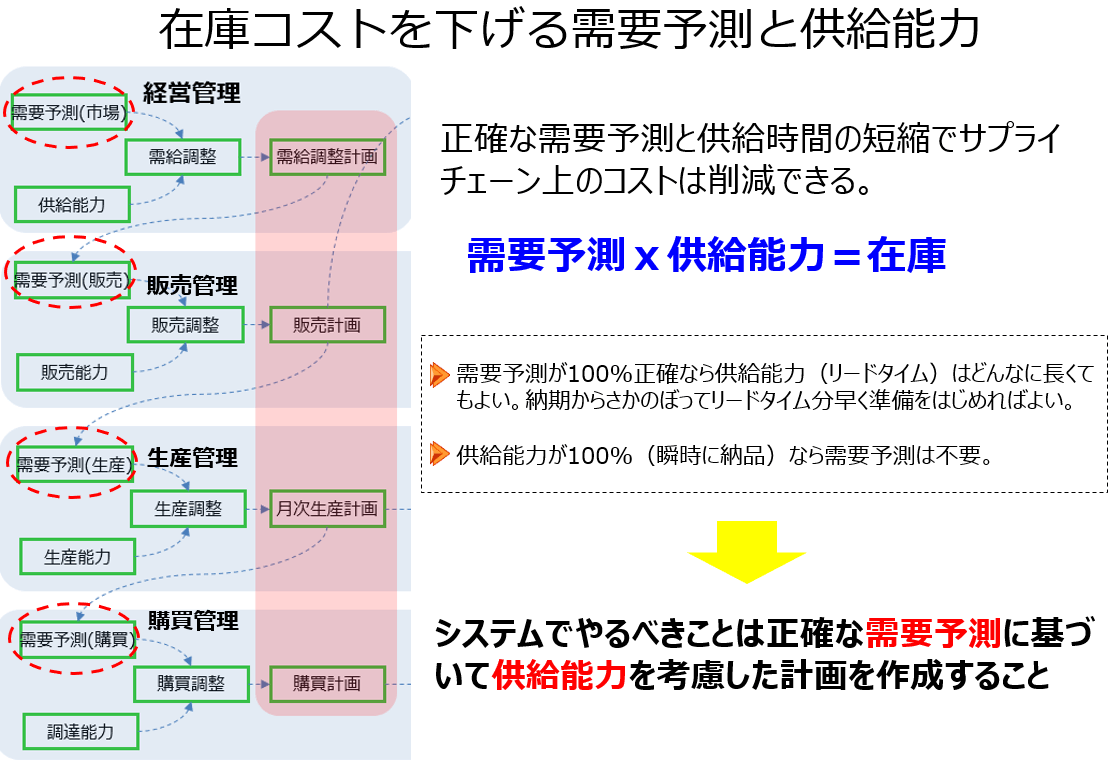 |
If zero inventory were feasible, it would require either 100% accurate demand forecasting with sufficient lead time for production or 100% supply capacity to meet demand instantly. Thus, inventory levels are determined by demand forecast accuracy and supply capacity.
The system’s role is to create plans that account for supply capacity based on accurate demand forecasting. |
Systems for Creating Overall Optimized Plans
Now, let me explain the steps to systemize "visualization for overall optimization."
 |
Let me explain what kind of system maximizes productivity to lower price costs and shortens manufacturing lead times to reduce inventory costs.
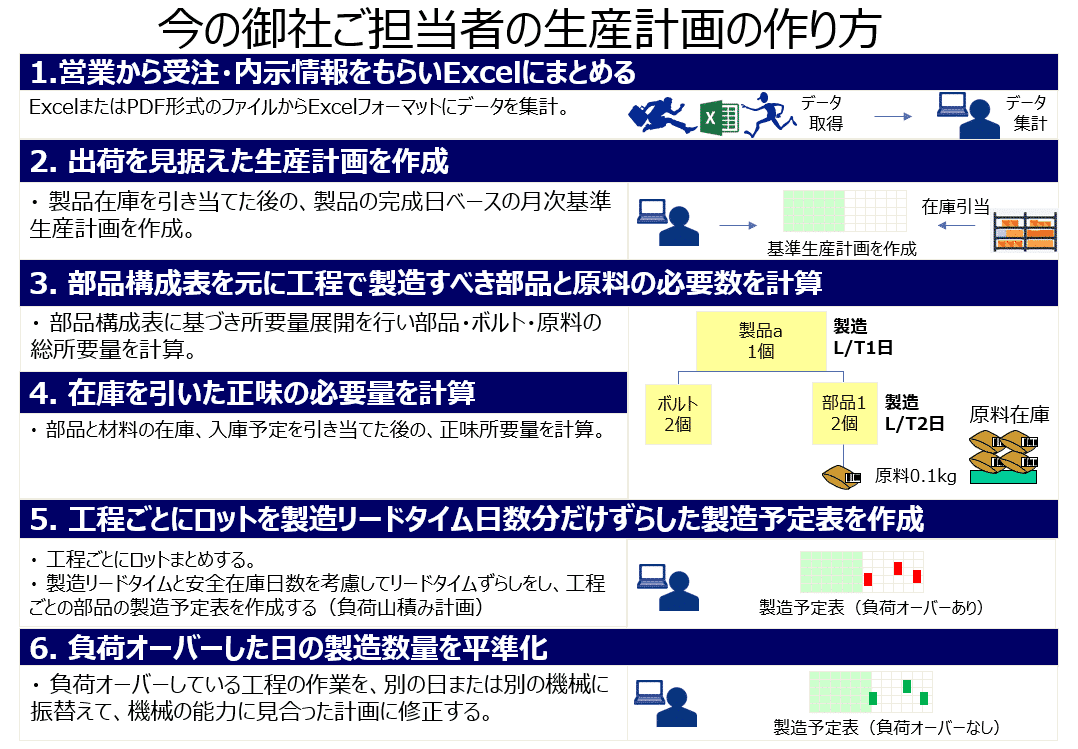
The process for factory planners is universal: they receive order and forecast data from sales, compile it in Excel, create a production plan with shipping in mind, calculate required parts and raw materials per process based on the bill of materials, compute net requirements after subtracting inventory, create a production schedule shifted by manufacturing lead time days per process, and level out production quantities for overloaded days. |
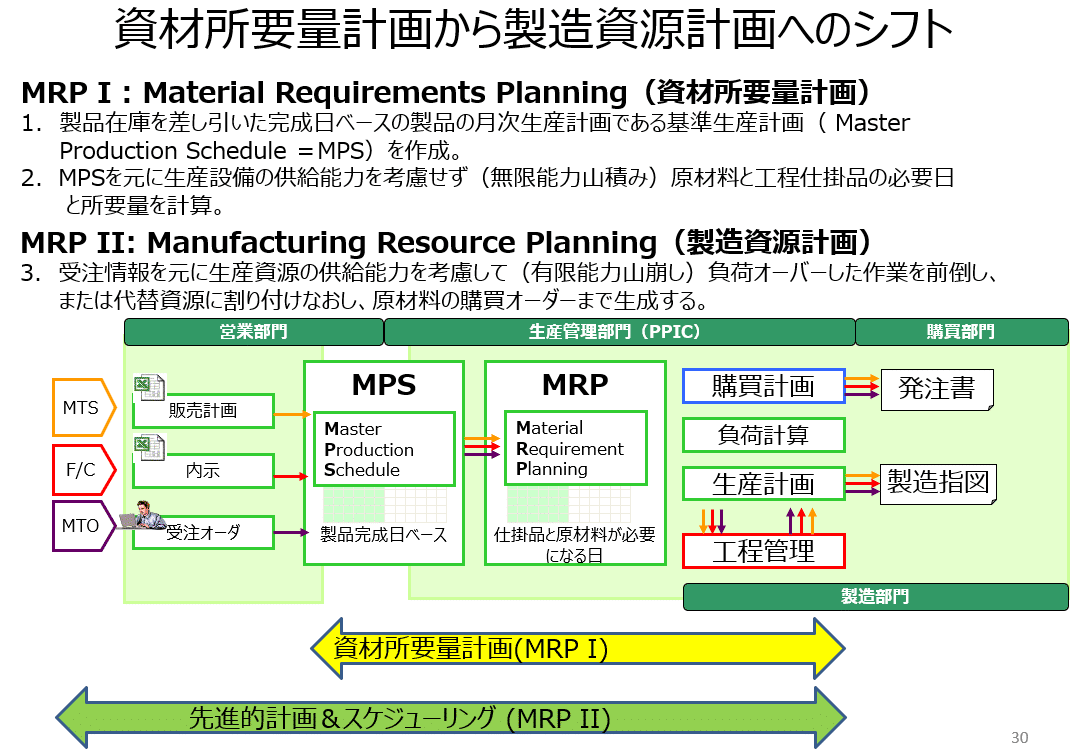 |
This touches on production management concepts. In typical production management package systems, Material Requirements Planning (MRP) uses order data to calculate requirements, generating manufacturing orders per process and calculating raw material purchase quantities.
However, this doesn’t account for process-specific equipment capacity, so excess capacity must be manually redistributed to available days—a task impractical as product types and equipment numbers increase.
Manufacturing Resource Planning (MRPII) considers equipment capacity, automatically assigns overloaded tasks to available days or other equipment, and generates purchase orders. |
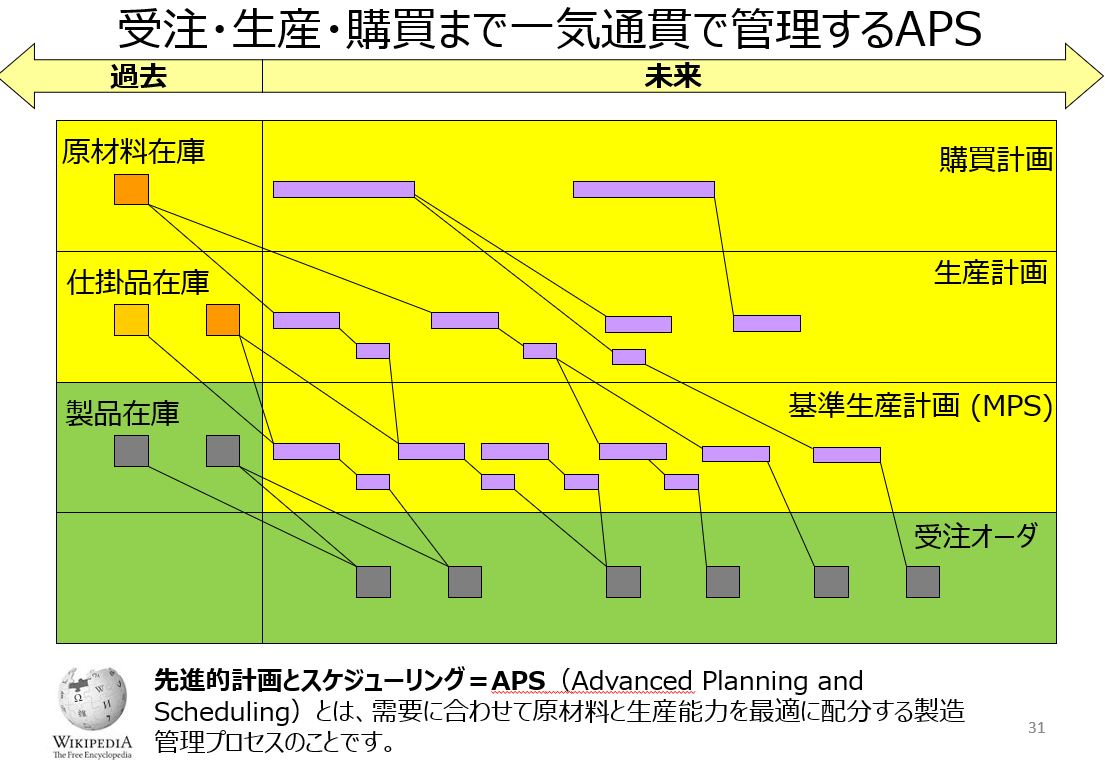 |
This is the concept of Manufacturing Resource Planning (MRPII), managing orders, production, and procurement end-to-end, improving per-unit productivity by shortening lead times and reducing inventory costs by cutting stock.
The function that automatically generates production plans while aiming for overall optimization is called APS (Advanced Planning and Scheduling).
In Japanese, it’s "先進的計画とスケジューリング" (Advanced Planning and Scheduling), and APS visualizes an overall optimized production schedule within process interconnections. |
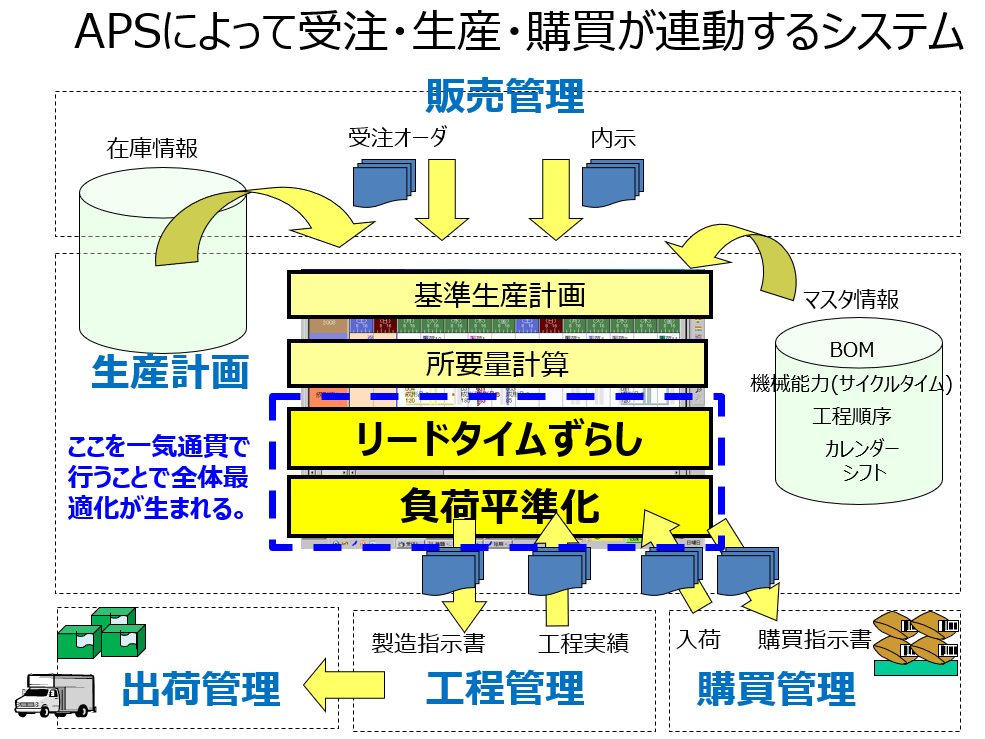 |
Here’s how APS manages orders, production, and procurement end-to-end: it imports order data, calculates net product requirements after subtracting inventory, and performs requirements planning.
Simultaneously, it assigns manufacturing orders to equipment while leveling loads to avoid exceeding capacity and issues purchase orders timed to meet manufacturing start dates.
APS performs this entire sequence in one go. |
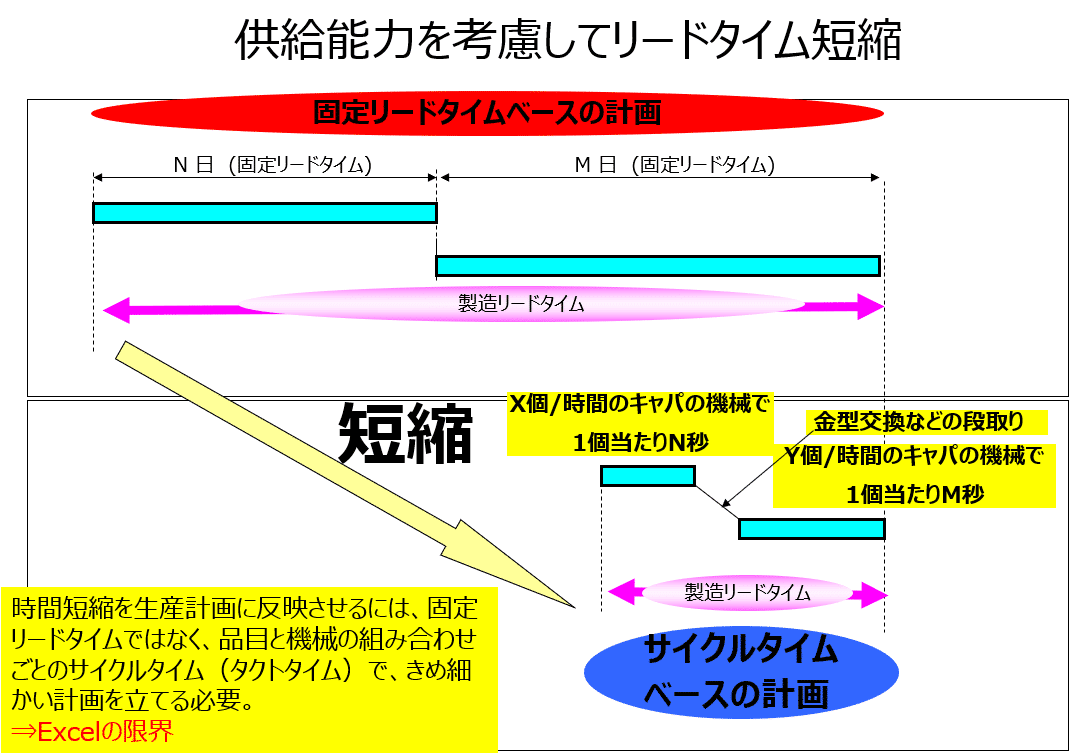 |
Unlike production management systems with fixed lead times, APS sets cycle times based on equipment capacity, creating a cycle-time-based production plan that accounts for machine capacity, shortening manufacturing lead times.
It can also set setup times for mold changes or tank cleaning, creating plans to reduce setup frequency by producing the same item consecutively.
Shortening manufacturing lead times increases per-unit productivity, reducing product costs. |
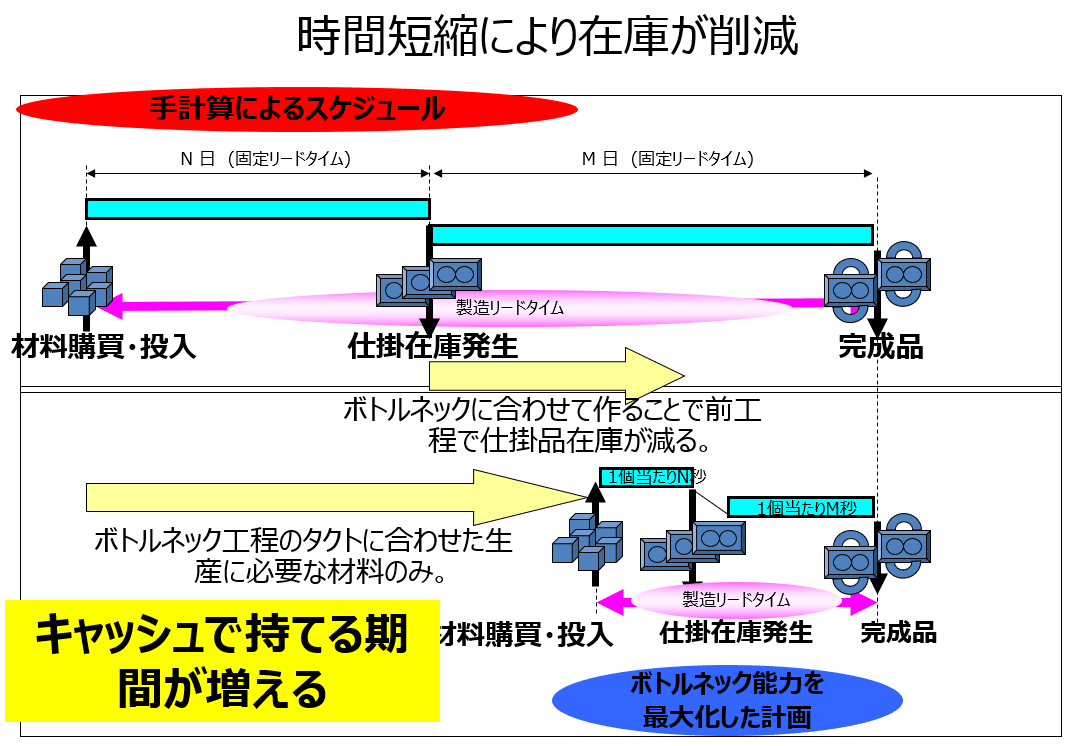 |
Shortening manufacturing lead times automatically reduces in-process inventory, cutting inventory costs.
This extends the period the company can hold cash, improving cash flow. |
Production Scheduler Functions
Lastly, a brief introduction to the production scheduler Asprova.
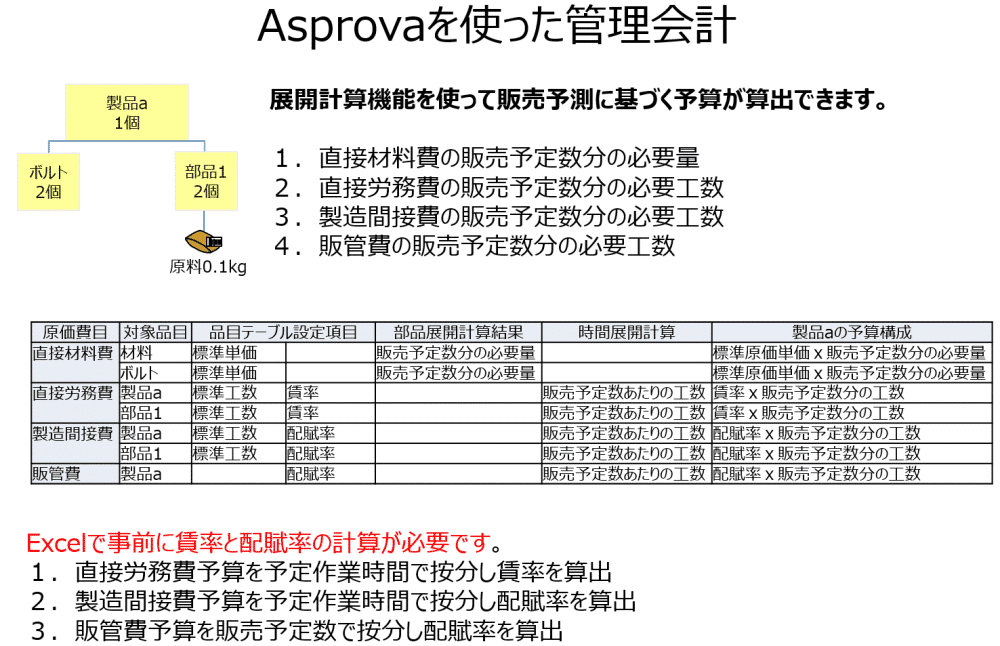 |
Asprova can perform expansion calculations. By setting standard material unit prices, labor wage rates and efficiency, and overhead allocation rates in the item master, it can calculate next season’s cost and sales budgets based on planned production quantities. |
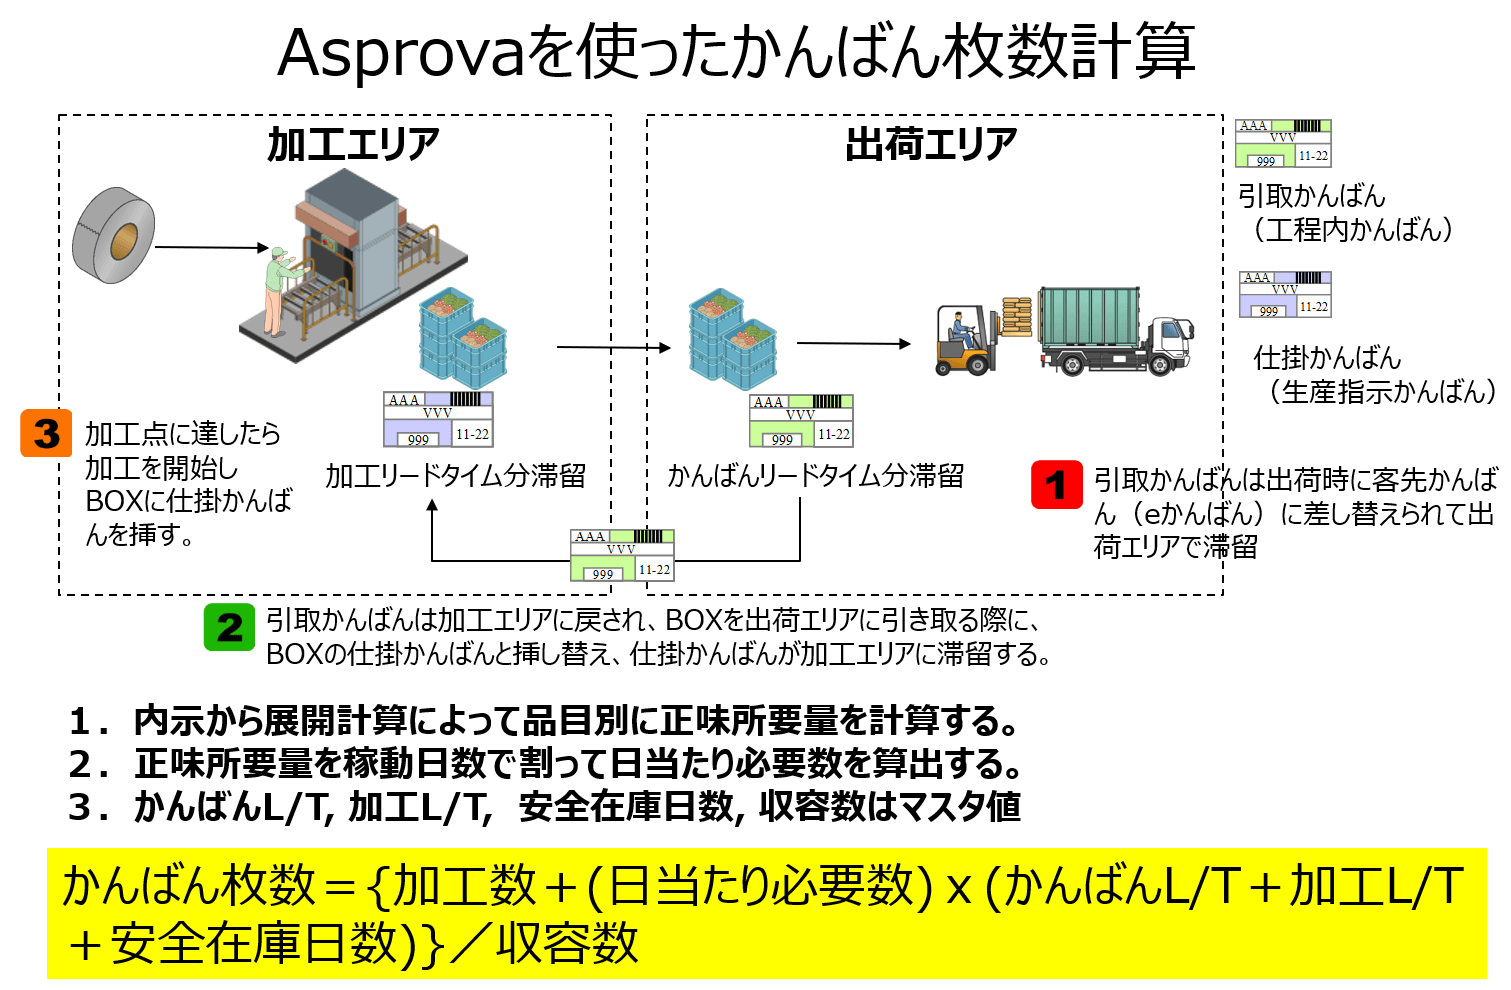 |
For companies delivering parts to TIMMIN or ADM in Indonesia, production lines may operate using a kanban system.
Calculating requirements with MRP based on forecasts is conceptually the same as calculating kanban quantities. With Asprova, you can update kanban quantities monthly, increasing or decreasing the kanbans flowing on-site as needed. |
Today’s discussion revolves around the production scheduler Asprova. At our company, we don’t approach "system implementation" with grandiosity. Our policy is to improve gradually, like using Excel, and integrate it into operations step-by-step. Basically, we can tailor the implementation to fit your budget.


