


In Indonesia, as manufacturing diversifies its production methods in proportion to the growing fluctuations in domestic market supply and demand, it becomes critical to appropriately revise plans in response to order changes and implement process management that visualizes progress against production instructions issued to the shop floor. Production Scheduler in Indonesia In Indonesia's Japanese manufacturing industry, the adoption of production management systems has been increasing. However, when it comes to one of the key challenges in production management—creating feasible production plans that take machine and equipment loads into account—manual work using Excel remains the standard practice. As a result, the demand for production schedulers is expected to grow in the future. 続きを見る

Chapter 1: Company Overview
Greetings, I’m Yamamoto from Bahtera High System. Thank you very much to everyone for attending amidst the busy year-end period. ⇒Click here for seminar details
In the first part, Kunie Co., Ltd. spoke about “production efficiency improvement.” I’ll now explain how to concretely systemize this, based on my experience and implementation case studies.
First, a brief introduction to our company.
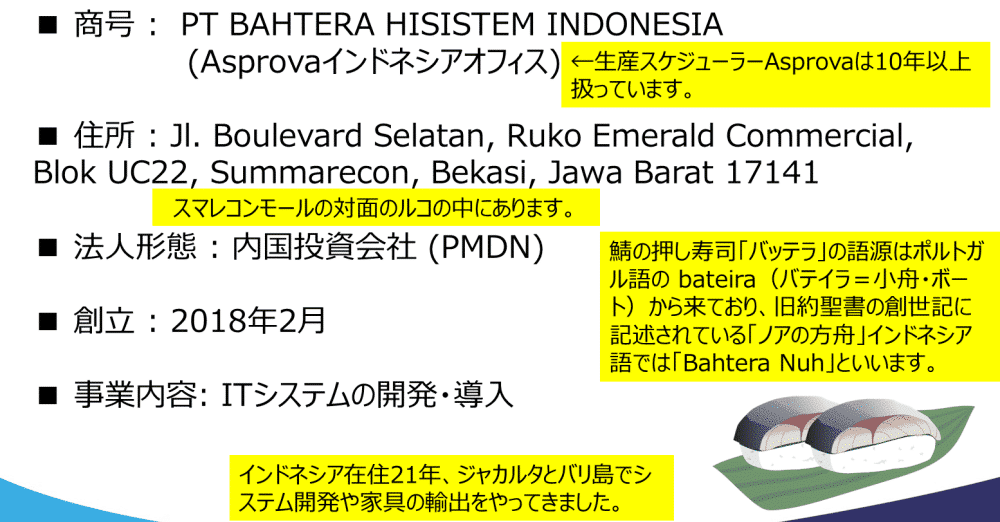
Bahtera High System is located in West Bekasi. Past the outer ring highway in Bekasi Barat, turning left leads to the Summarecon development area, where our office is in a Ruko (shop-house).
Having handled Asprova production scheduler implementations for about 10 years in my previous job, I now operate as an Asprova agent at Bahtera, carrying the business card of “Asprova Indonesia Office.”
Established in February this year, we focus on developing and implementing manufacturing systems. I’ve been in Indonesia for 21 years, working on system development and furniture exports in Jakarta and Bali.
The name “Bahtera” comes from the Portuguese word, like the pressed mackerel sushi “battera,” meaning “ark” in Indonesian. The famous Noah’s Ark from the Old Testament is “Bahtera Nuh” in Indonesian, which inspired our name.
One means to achieve business improvement is systemization, which enables:
- Efficiency and accuracy in data entry
- Effective use of information through visualization, sharing, and systematization
When realized, shop floor information generates corporate competitiveness.
To deliver tangible benefits from system implementation, we thoroughly gather customer requirements and propose systems focused on:
- How much current operations have improved
- What new outcomes have emerged
Chapter 2: Recent Challenges Facing Indonesian Factories
Let’s start with “recent challenges facing Indonesian factories.” You, being close to daily production, likely know these better than I do. Here, I’ll focus on challenges improvable through production planning and process management systemization.
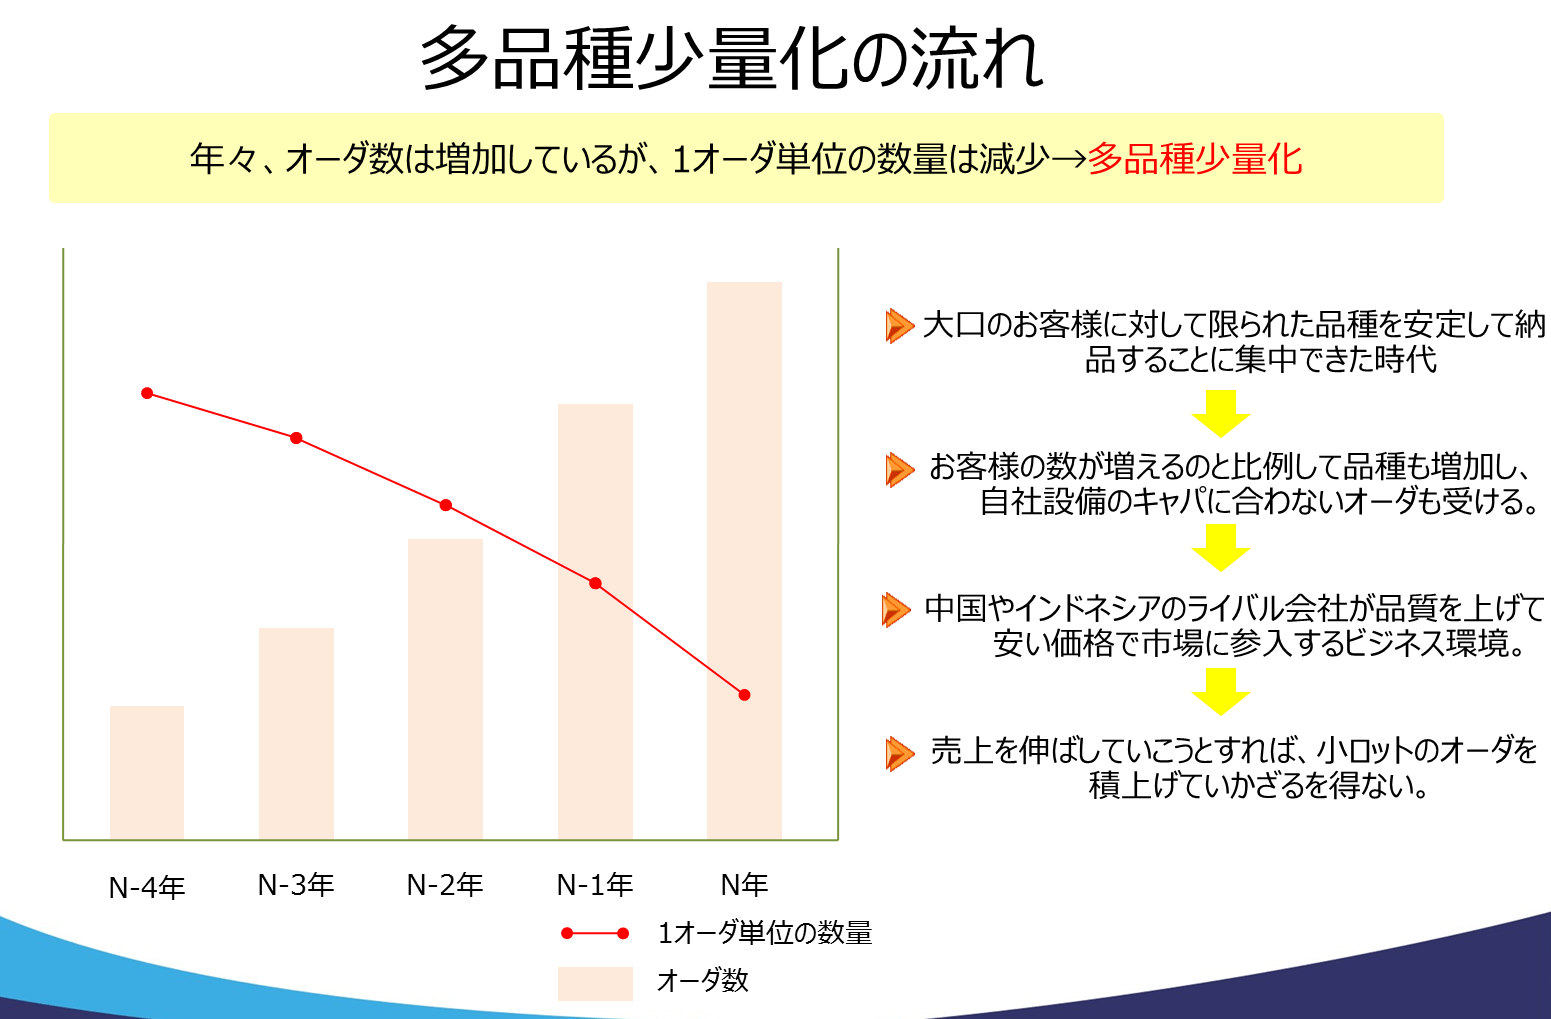
The trend toward high-variety, low-volume production has been discussed for years. The era of “just stably delivering limited varieties to major customers” is gone, and as customer numbers grow, so do product varieties.
Ideally, companies would receive orders matching equipment capacity, but with Chinese and Indonesian competitors raising quality and entering markets cheaply, Indonesia’s business environment grows tougher yearly. To increase sales, firms can’t be picky and must stack small-lot orders.
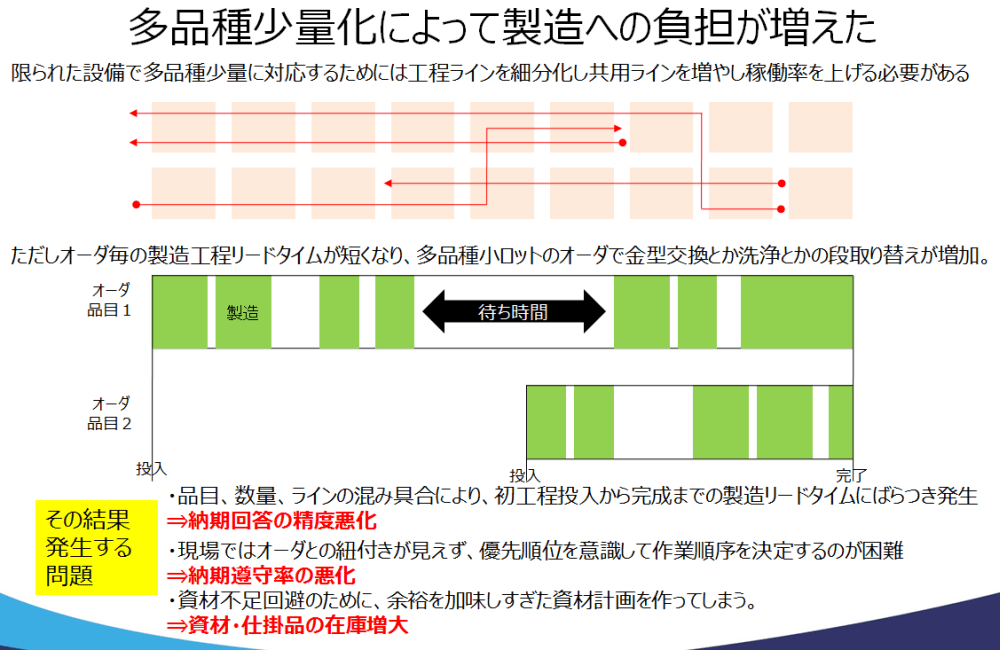
To manage high-variety, low-volume production with limited equipment, production lines are subdivided, and shared lines increased to boost overall utilization.
However, smaller lots shorten per-process lead times, inevitably increasing setup changes like mold swaps or cleaning. This results in:
- Variability in total production lead time from initial input to completion, complicating delivery date responses.
- Difficulty linking orders on-site, hindering prioritization and worsening on-time delivery rates.
- Excessive material and work-in-progress inventory to avoid line stoppages from shortages.
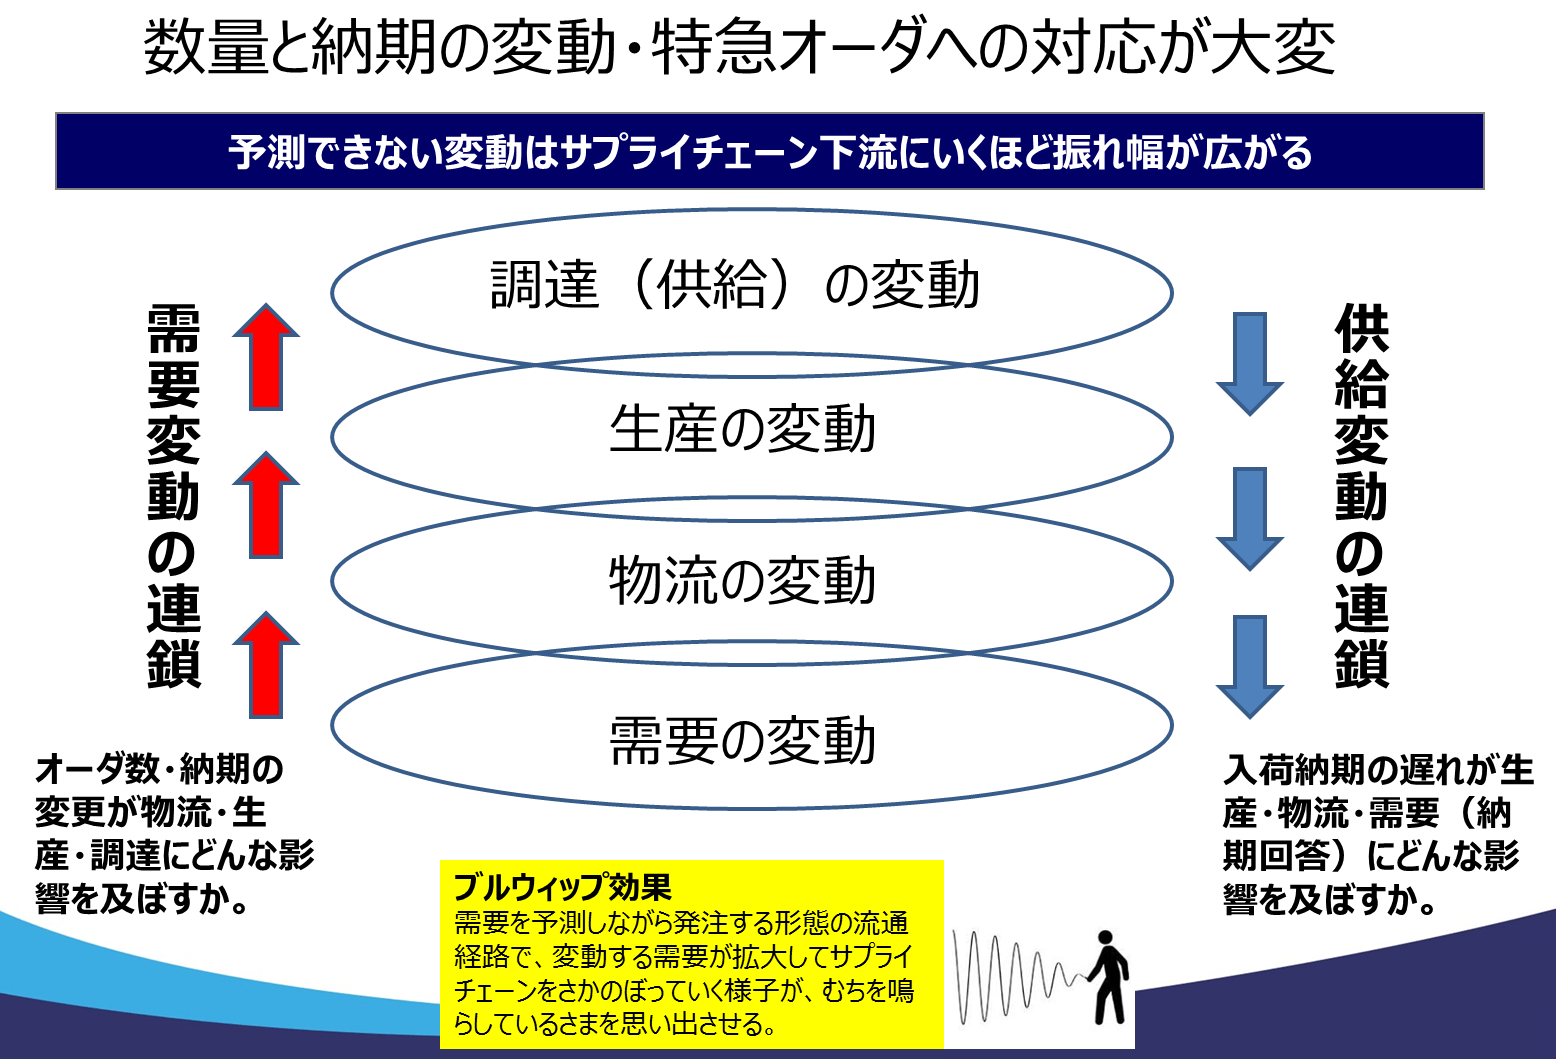
More customers mean varied circumstances, bringing challenges absent when focusing on stable supply to major clients:
- Quantity fluctuations
- Delivery date fluctuations
- Rush order interruptions
Such fluctuations upstream in the supply chain amplify downstream toward production and procurement—a phenomenon called the bullwhip effect.
Conversely, procurement fluctuations can significantly impact upstream demand—a reverse bullwhip effect, so to speak.
In a world of high-variety, low-volume production with fluctuating forecasts, decision-makers’ responsibility in factories grows increasingly critical.
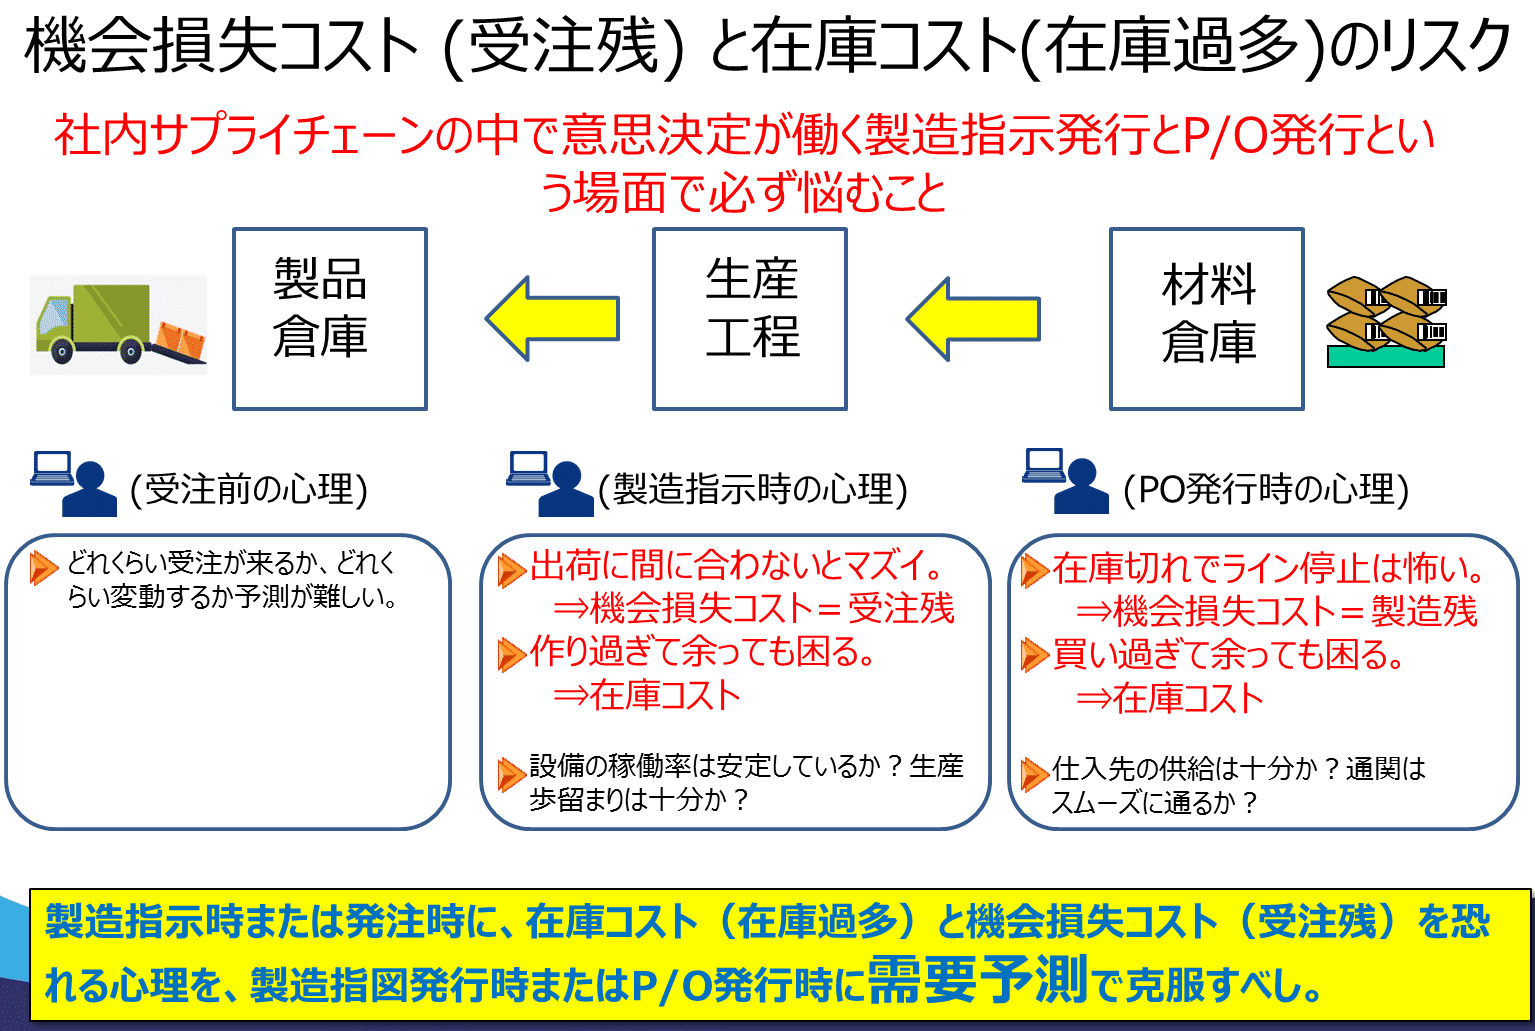
Factories receive orders, procure materials, manufacture, and ship. Within this internal supply chain, decision points are “production instructions (when and how many to make)” and “ordering (when and how many to order).”
At these key moments, staff typically consider two things. For production:
- “It’s trouble if production misses shipping deadlines.”
- “It’s trouble if we overproduce and have excess.”
For procurement:
- “It’s trouble if materials don’t arrive in time for production.”
- “It’s trouble if we overbuy and stockpile materials.”
These are opportunity loss costs and inventory costs—tough but surmountable challenges. Positively framed: “Overcome the fear of inventory and opportunity loss costs at production instruction or ordering with demand forecasting.”
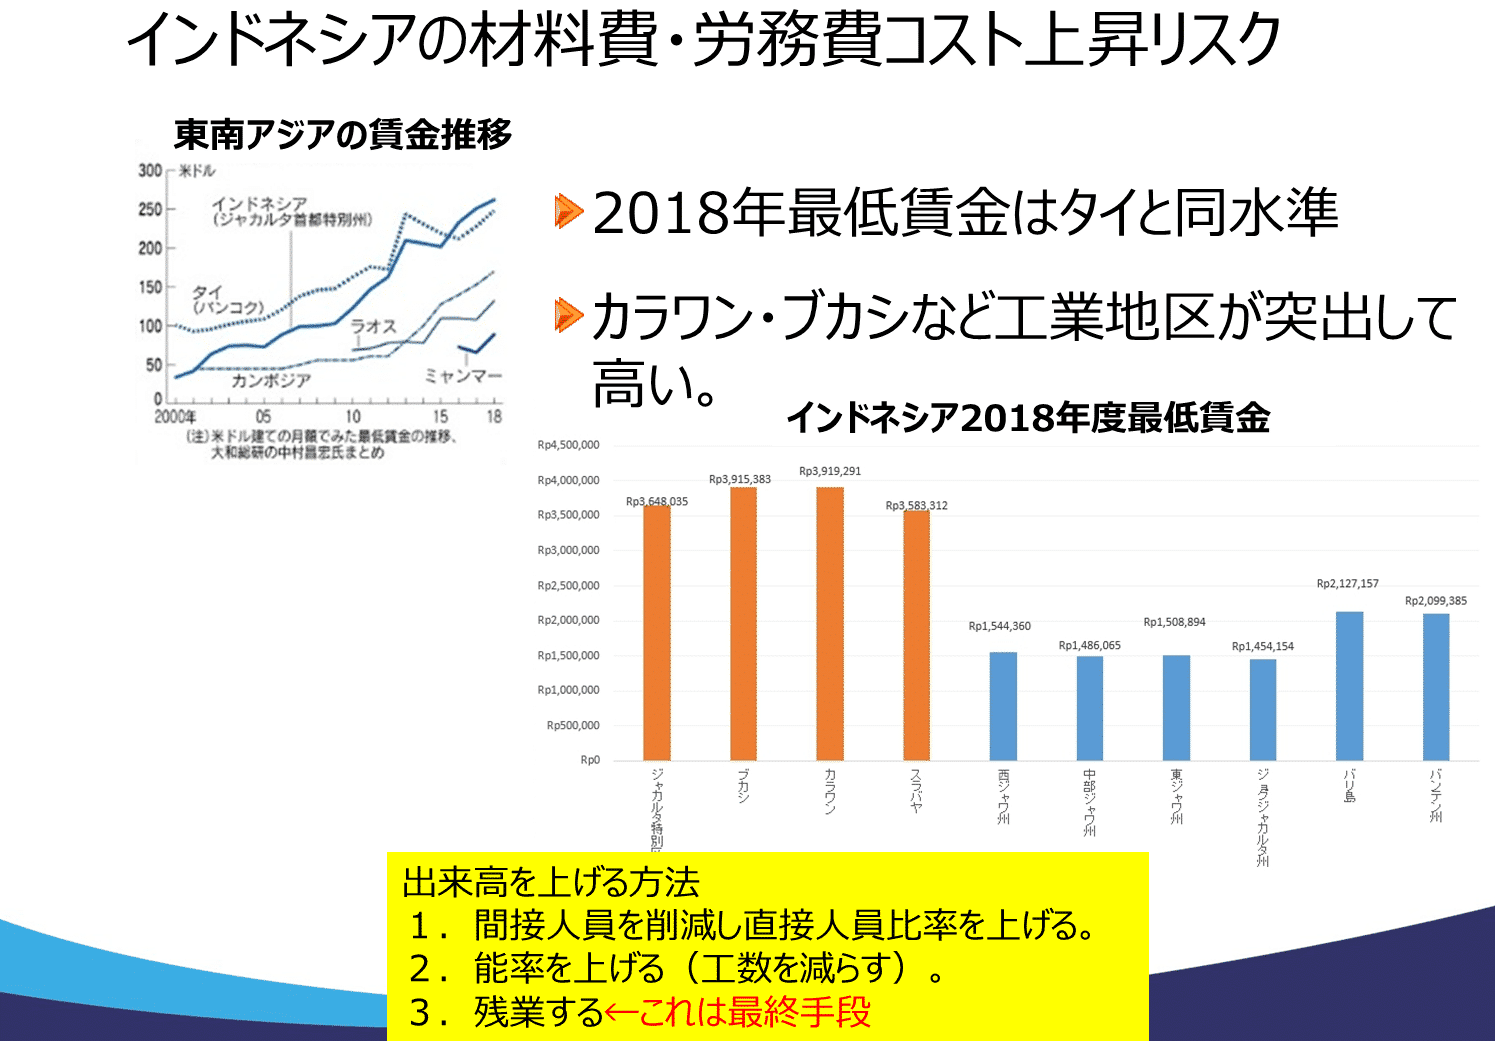
As you know, the 2018 minimum wage in Karawang and Bekasi exceeds 3.9 million IDR, double that of Central Java. It’s understandable why people seek jobs in the capital, arriving at Gambir Station like the old collective employment trains to Ueno.
Unrelated, but Gambir Station has changed a lot. It used to be chaotic with ticket scalpers, but now it’s rebuilt with chic shops like Momoiro chiffon cake and cafes.
Rising labor costs increase labor rates. To maintain output with higher rates:
- Increase direct labor ratio
- Boost efficiency (reduce man-hours)
- Service overtime ← Not an option due to being exploitative
Overtime is like doubling down on a losing bet, so efforts must focus on reducing indirect labor ratios or improving efficiency through business improvement.
Chapter 3: Effects of Time Reduction and Inventory Reduction
Considering these risks, Chapter 3 explores how to translate business improvement into systems and under what policies. The risks from Chapter 2 inform improvement policies, which then shape systemization policies.
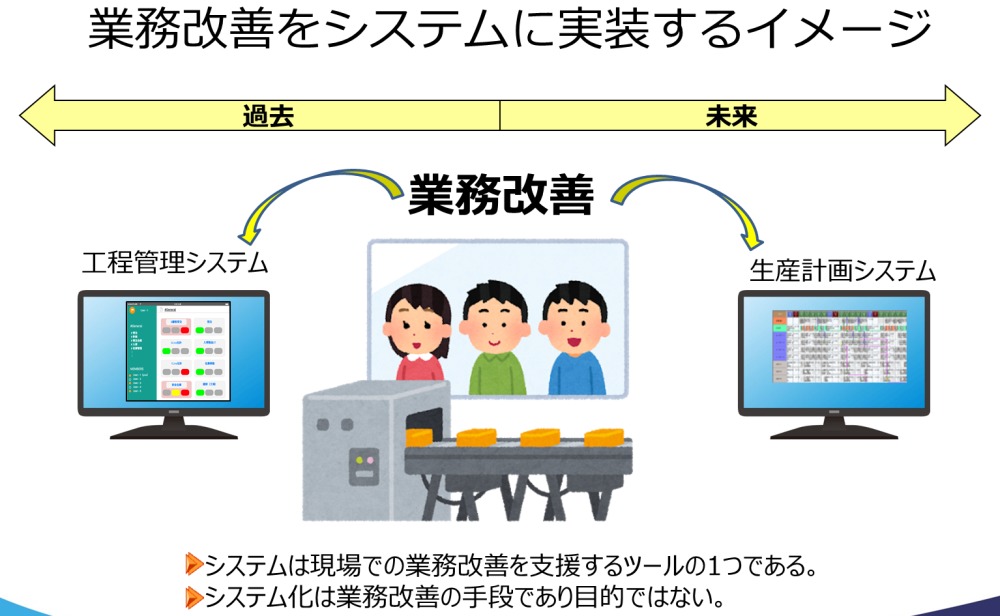
Dividing by time axis, we categorize systems into process management systems tracking current performance and production planning systems for future schedules—both tools, not ends, to achieve business improvement.
Systems like process, inventory, sales, and procurement management are for partial optimization, aiming to accurately record departmental quantities and times.
However, overcoming risks like demand fluctuations and rush orders requires more than partial optimization—it demands an overall optimization perspective, overseeing all departments end-to-end.
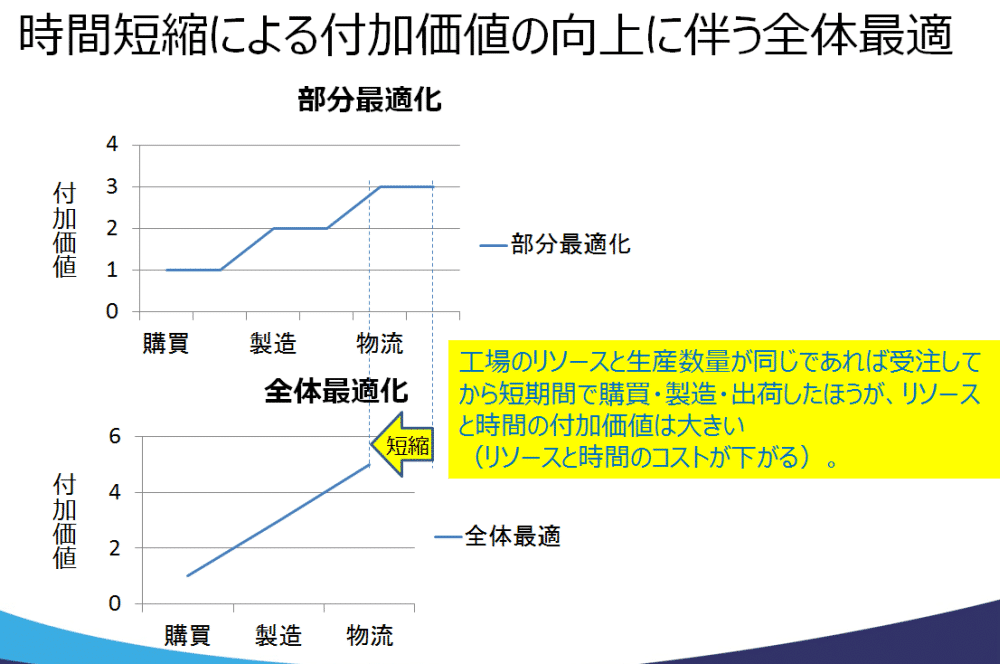
We cited rising labor costs as a challenge for Indonesian factories, with efficiency improvement (man-hour reduction) as one solution. In the internal supply chain from procurement to production and shipping, time reduction enhances the value of time and resources.
However, blind time reduction isn’t the answer. If upstream efficiency rises but downstream can’t match it, work-in-progress inventory grows. Partial optimization in one department doesn’t guarantee overall optimization or added value.
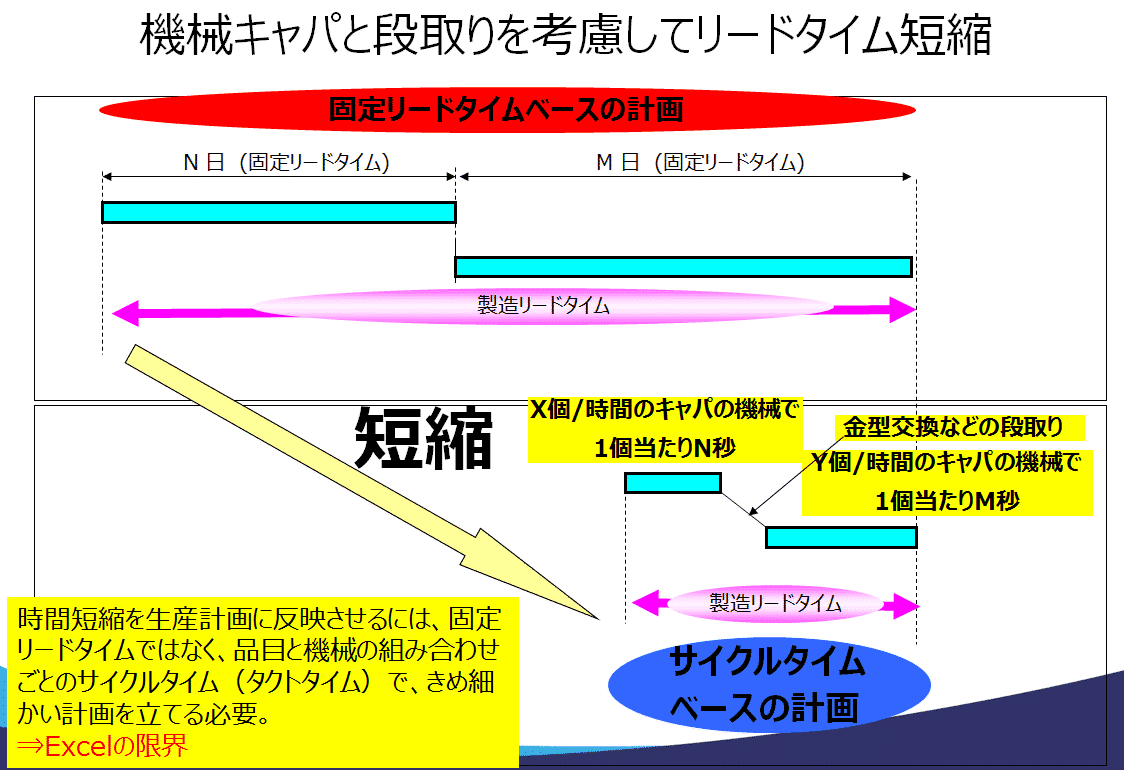
To reflect time reduction in production planning, plans must shift from fixed lead times to detailed cycle-time or takt-time bases per item-equipment combination, considering daily production capacity and setups. Without this, plans become unfeasible on-site.
Setups don’t occur with continuous same-item lots but overdoing it builds excess inventory—a dilemma. Constraints like “consolidate same-item lots for orders due within a week” must be reflected in plans. This optimization reveals Excel’s limits for planning.
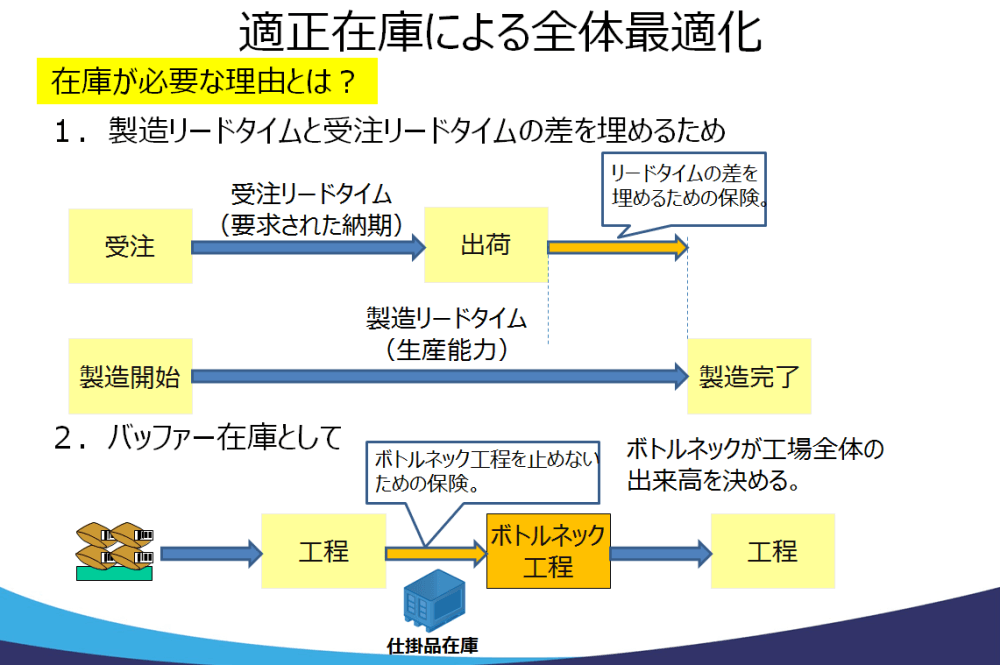
Next, consider optimal inventory for overall optimization—why hold inventory? Two reasons:
- Order lead time (order to shipment) is shorter than production lead time (start to finish), so inventory insures against delays.
- Buffer to prevent stopping bottleneck process lines.
Holding two days’ shipping inventory to avoid delays is common, but keeping bottleneck lines running matters because overall takt time depends on the bottleneck’s takt. A delay there affects total takt and output.
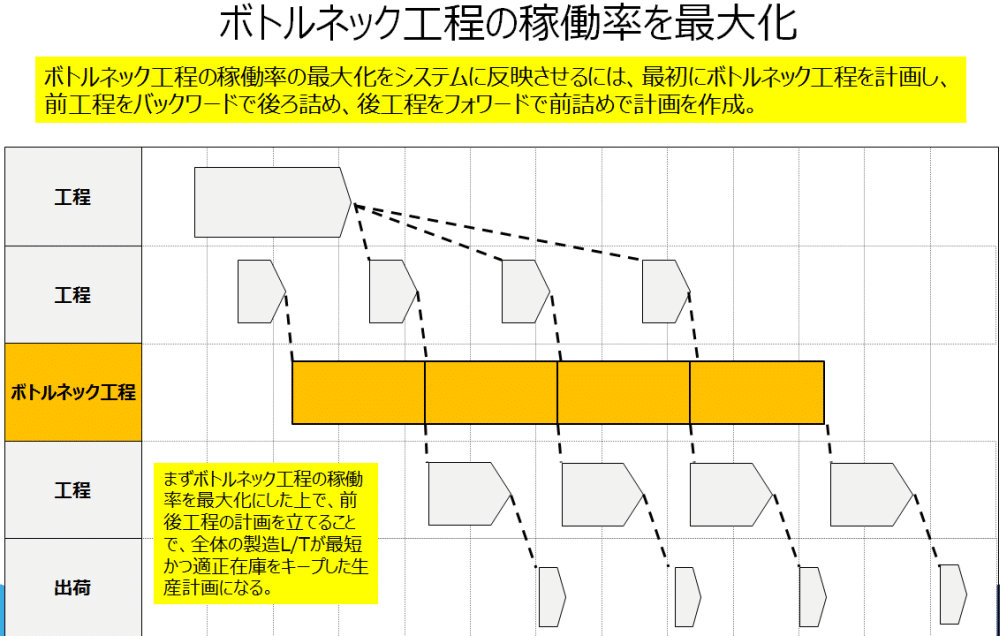
Like time reduction, maximizing bottleneck utilization in systems involves planning the bottleneck first, backward-scheduling upstream, and forward-scheduling downstream.
Maximizing bottleneck utilization, then planning other processes, creates the shortest production lead time and optimal inventory plan. Procuring only materials needed for bottleneck-aligned production reduces upstream work-in-progress.
Realizing time reduction and bottleneck maximization for optimal inventory frees cash previously tied in materials and work-in-progress. Delaying procurement to match overall takt timing further increases cash availability.
Business improvement processes eventually tie into such cash flow benefits.
Chapter 4: Systemization Case Studies Considering Overall Optimization
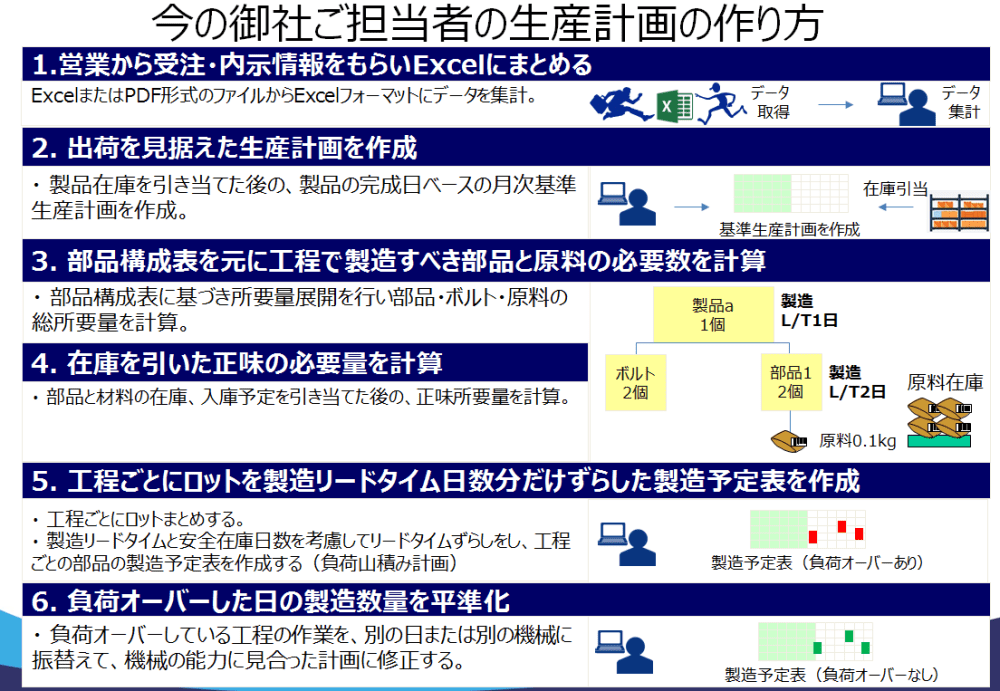
I’ll introduce a system implementation example reflecting the “lead time reduction” and “optimal inventory” overall optimization policies from prior chapters. Your factory planners likely follow this process.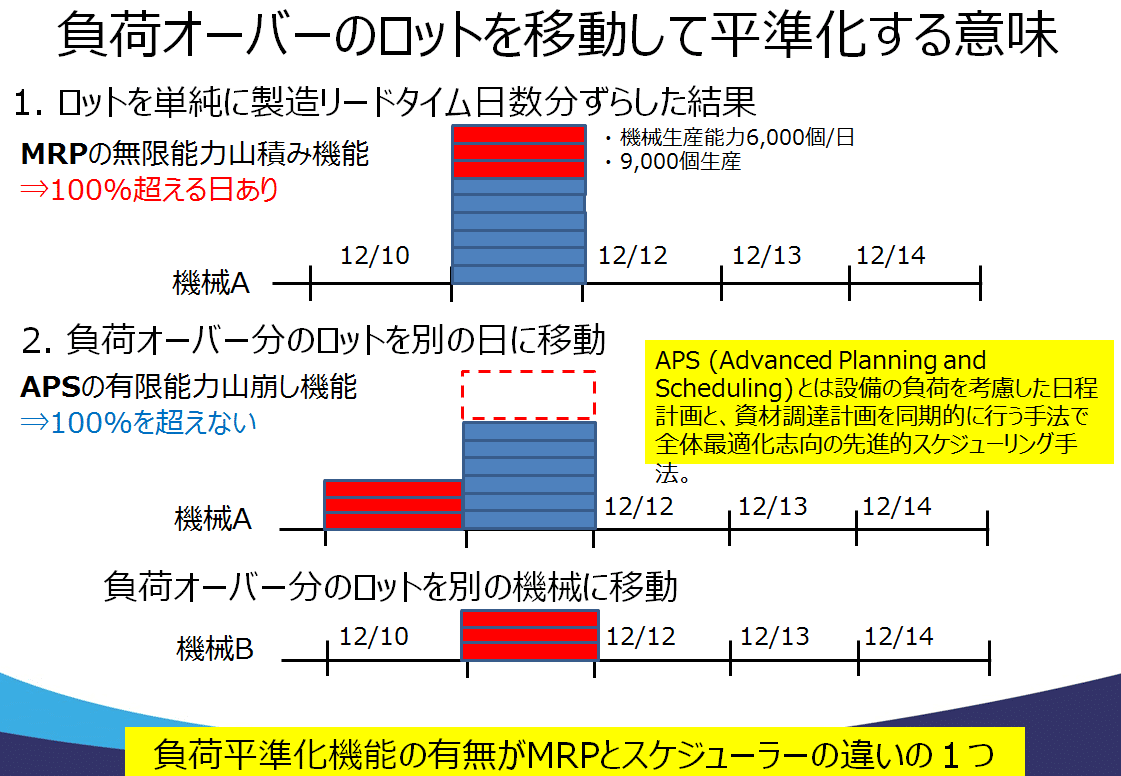
Offsetting by fixed lead times, called infinite capacity loading, assumes unlimited machine capacity, often overloading lots beyond 100% on some days.
Overloaded lots are shifted to other days on the same machine or to available days on other machines. APS (Advanced Planning and Scheduling) automates this, synchronizing production and procurement plans with machine load for overall optimization.
Two issues plague typical Indonesian planning: 1) Despite aiming for shipment-aligned plans to meet customer needs, PPIC staff focus solely on production, creating discretionary, partially optimized plans, causing:
- Delays in sales reporting status and delivery dates to customers.
- Delays handling order quantity/delivery changes and rush orders.
2) Process-specific lead time offsetting and leveling, ignoring preceding/following process capacities or loads, optimizes lots per process. Simple lead time offsetting and leveling tend toward partial optimization, potentially overwhelming downstream, increasing wait times and inventory.
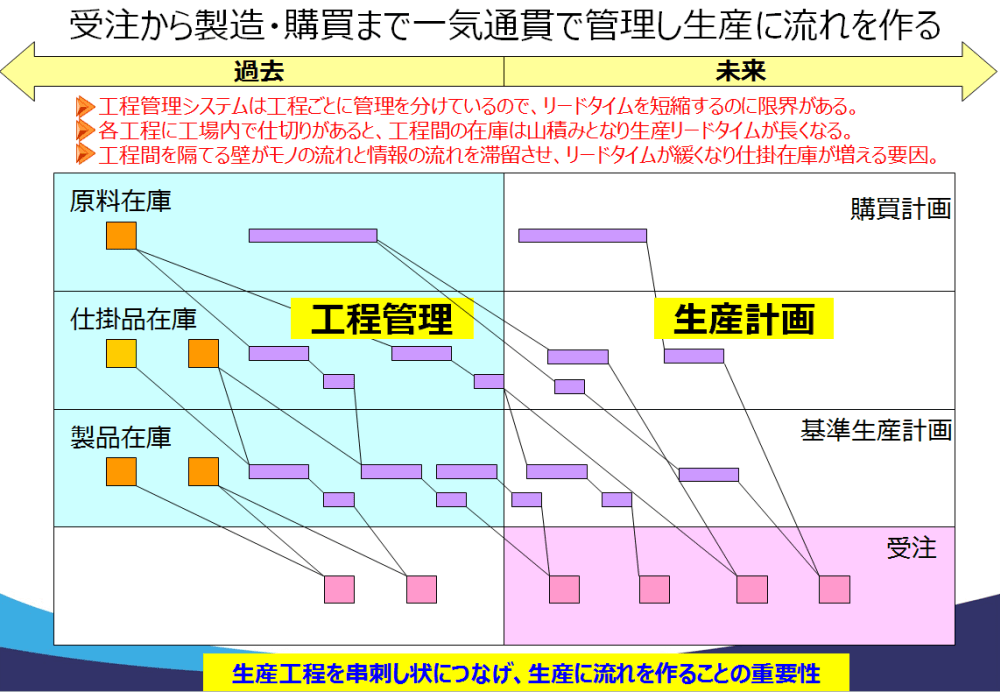
Linking sales order data with PPC production plans,串刺し (skewering) order-to-production-to-procurement and visualizing it creates production flow, shortens lead times, and prevents inventory buildup.
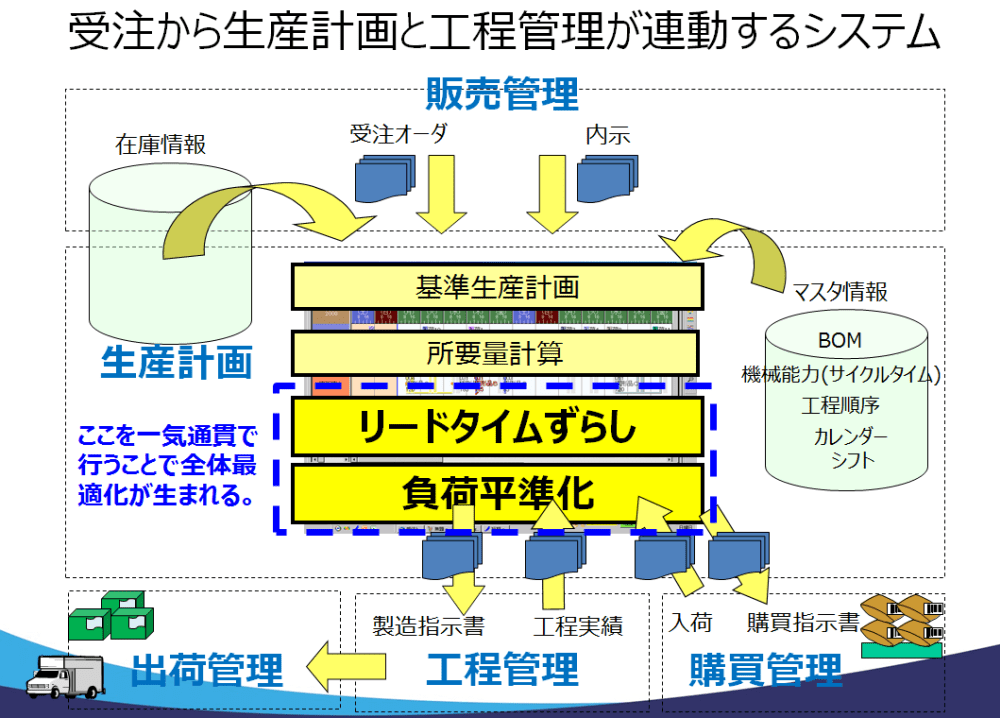
Excel’s manual limits emerge when setting upstream task days via lead time offsetting from the master plan, then advancing overloaded tasks or shifting them to other equipment. End-to-end execution achieves overall optimization.
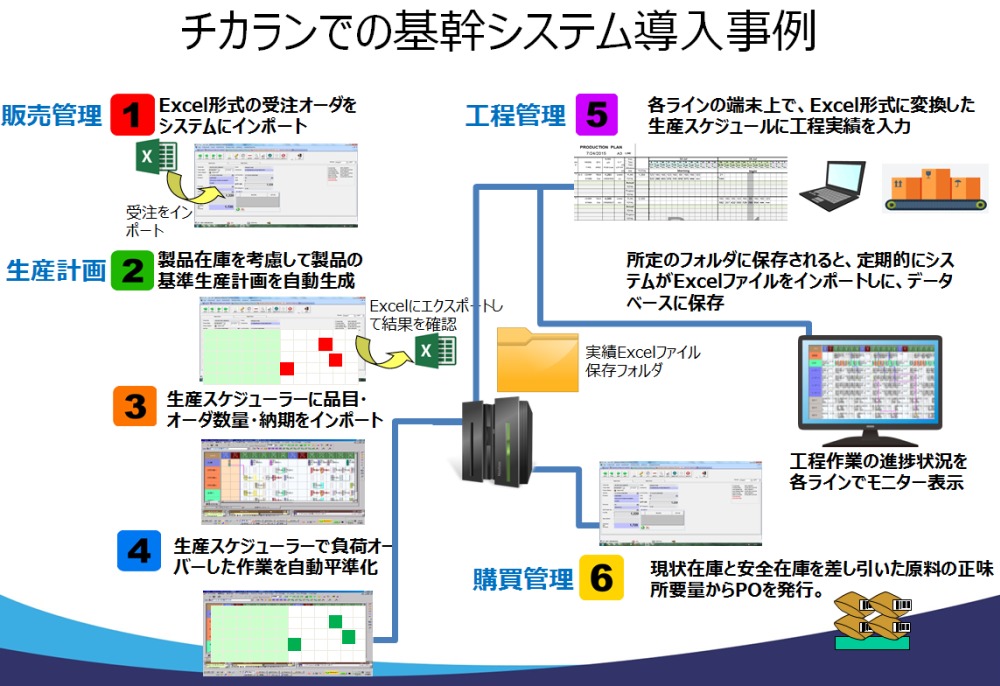
At this Cikarang factory, order data from sales, considering product inventory, auto-generates a master production plan. Importing item, order quantity, and delivery dates into Asprova unfolds parts while offsetting lead times on a cycle-time basis, automatically leveling overloaded days’ tasks.
Operators input process performance on familiar Excel sheets, uploaded post-shift from line terminals to a server folder, processed into Asprova performance data by the system.